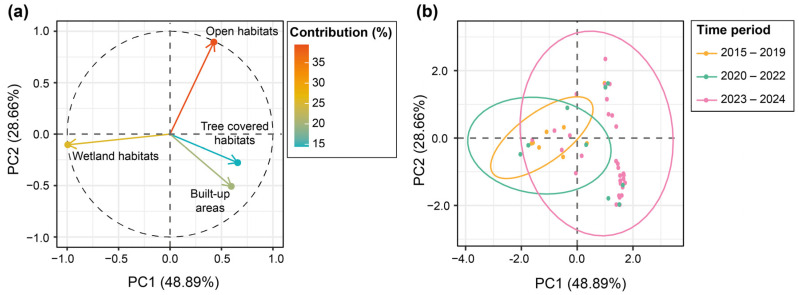
Figure 4.
Plots showing the ACP results. Plot (a) displays the contributions of the four land cover types to the first two principal components (PC1 and PC2), explaining 48.89% (PC1) and 28.66% (PC2) of the total variance. See Appendix A, i.e., Table A1, for the factor loadings of the four types of land cover on the PC1 and PC2. The color gradient represents the magnitude of contribution from each land cover type, with red indicating higher contributions and green indicating lower contributions. Plot (b) shows the distribution of eBird observations along PC1 and PC2 for different time periods. Ellipses give a visual indication of the spread and central tendency for each time period, with a confidence level of 95%.

