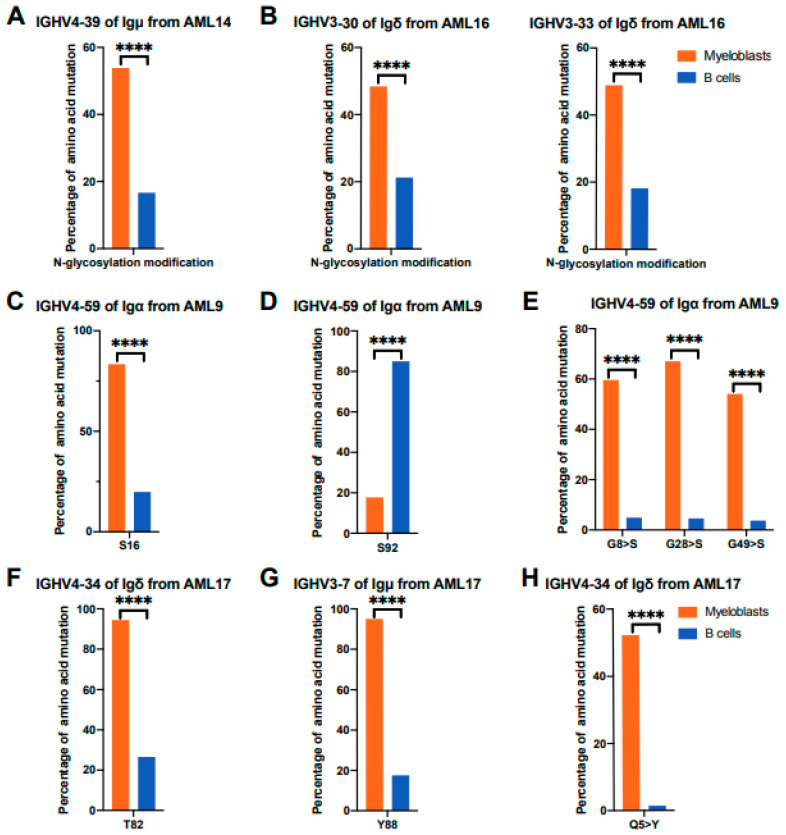
Figure 5.
Comparisons of VH mutation sites related to post-translational modifications between myeloblasts and B cells. (A) Proportion of VH with potential N-glycosylation modification sites in myeloblasts and B cells. Comparison of IGHV4-39 of AML-Igμ (n = 39) and B-Igμ (n = 64) from AML14. (B) Comparison of IGHV3-30 of AML-Igδ (n = 832) and B-Igδ (n = 240) from AML16 (left panel). Comparison of IGHV3-33 of AML-Igδ (n = 1343) and B-Igδ (n = 121) from AML16 (right panel). (C–E) The mutation frequencies of S16 (C), S92 (D), and G8>S, G28>S, and G49>S (E) in IGHV4-59 of AML-Igα (n = 106) and B-Igα (n = 315) from AML9. S, serine; G, glycine. (F) The mutation frequency of T82 in IGHV4-34 of AML-Igδ (n = 2903) and B-Igδ (n = 196) from AML17. T, threonine. (G) The mutation frequency of Y88 in IGHV3-7 of AML-Igμ (n = 202) and B-Igμ (n = 90) from AML17. Y, tyrosine. (H) The mutation frequency of Q5>Y in IGHV4-34 of AML-Igδ (n = 2903) and B-Igδ (n = 196) from AML17. Q, glutamine. The association between cell types and mutations was tested by the chi-square test. **** p < 0.0001.

