Figure 7.
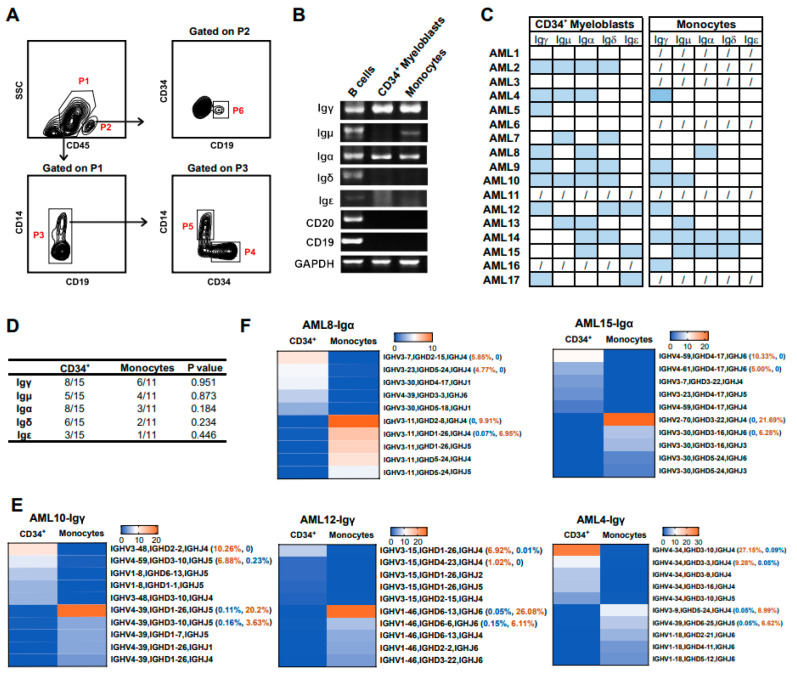
Myeloid cells at different differentiation stages expressed different Ig rearrangement patterns. (A) The representative gating strategy for myeloid cells. Myeloblasts (P4, CD45+/CD19−/CD14−/CD34+) and mature monocytes (P5, CD45+/CD19−/CD34−/CD14+) were obtained by gating on P3. B cells (P6, CD45+/CD19+) were obtained by gating on P2. (B) Representative PCR detection of Ig in CD34+ myeloblasts and mature monocytes. (C,D) Statistical analysis of Ig expression in CD34+ myeloblasts and mature monocytes from 17 AML patients. (C) The blue box represents Ig expression, the white box represents no Ig expression, and the forward slash indicates that the samples were not assessed. (D) Quantification of Ig expression in CD34+ myeloblasts and mature monocytes. The association between cell types and the expression of Ig was tested using the chi-square test. (E,F) The biased V(D)J rearrangement patterns were used by CD34+ myeloblasts and mature monocytes. Heatmaps showed the top five V(D)J rearrangement patterns of two classes of heavy chains, including γ (E) and α chains (F).

