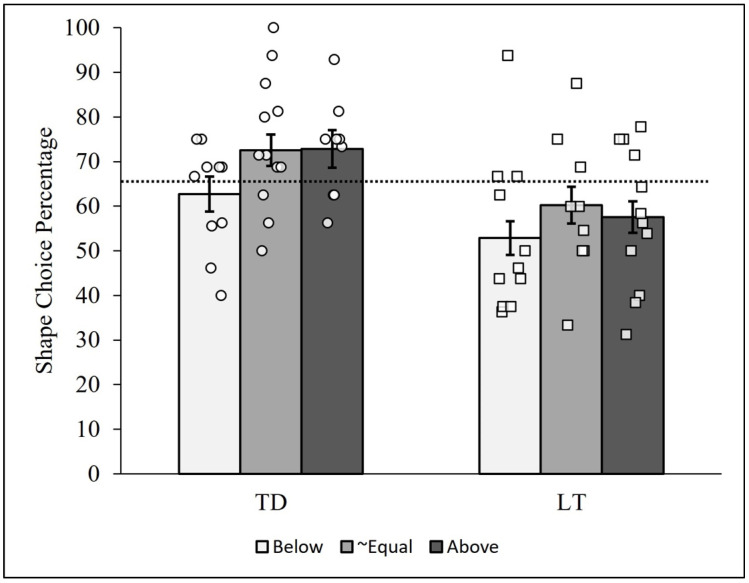
Figure 5.
Person-centered shape choice results between talking status and shape residuals. Note: Bars represent the group-level shape choice PCCs for the typically developing (TD) and late-talking (LT) children below, approximately equal to, and above expected shape residual scores. Each circle represents a TD child, and each square represents an LT child. The dashed line represents the median shape choice percentage (PCCmdn = 65.48%) across all 64 children. The error bars represent the standard deviations of the 10,000-iteration randomized PCCs for each trial and group.

