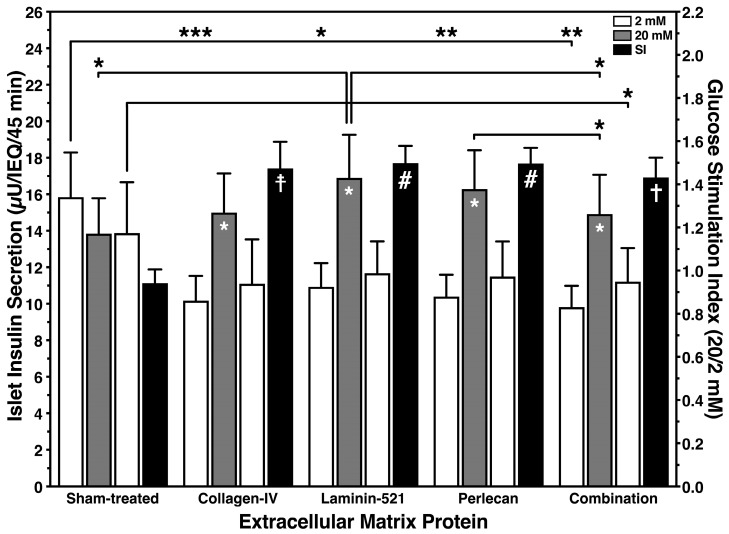
Figure 4.
Glucose-stimulated insulin secretion after 4–5 days of culture in a hypoxic atmosphere utilising different islet BMPs as supplements for culture media. Basal (white bars), stimulated insulin release (grey bars) and GSI (black bars) of 20 human islets are normalized to IEQ. Symbols inside white and grey bars indicate * p < 0.05 for 2 vs. 20 mmol/L of glucose. Lines/arrows indicate *** p < 0.001, ** p < 0.01, * p < 0.05 for comparison of basal or stimulated insulin release. Symbols inside back bars indicate # p < 0.001, ‡ p < 0.01, † p < 0.05 for comparison of GSI calculated for different treatment groups.

