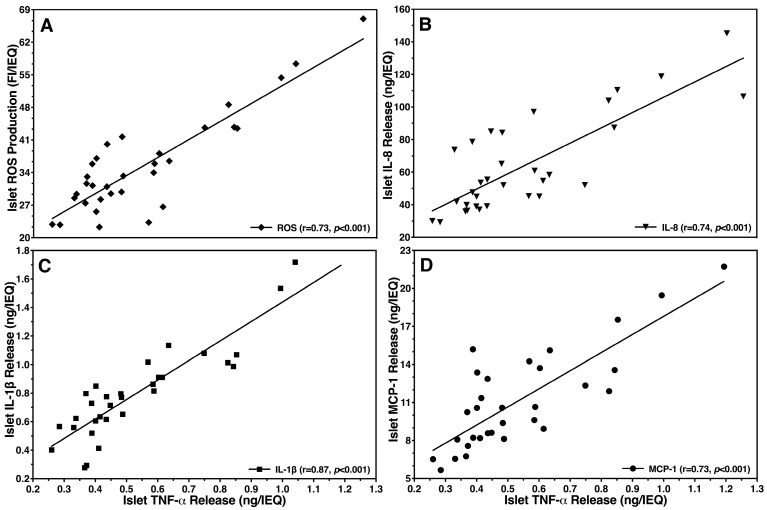
Figure 6.
Effect of islet TNF-α release in hypoxic atmosphere on (A) intra-islet production of ROS (◆) or release of (B) IL-8 (▼), (C) IL-1β (■) and (D) MCP-1 (●). Each data point represents the release or, respectively, production of different chemokines or ROS in relation to the corresponding TNF-α secretion. The correlation coefficient (r) was calculated using Spearman’s rank correlation after outlier identification (n = 31).

