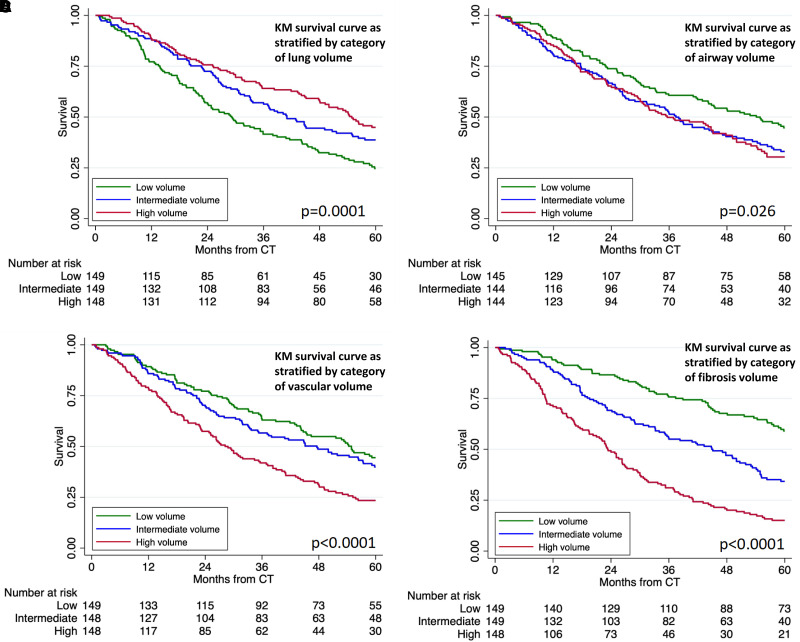
Figure 3.
(A–D) KM survival curve for combined PROFILE cohort stratified by category (tertile) of lung volume (A), airway volume (B), vascular volume (C), and fibrosis volume (D). CT = computed tomography; KM = Kaplan-Meier; PROFILE = Prospective Observation of Fibrosis in the Lung Clinical Endpoints.

