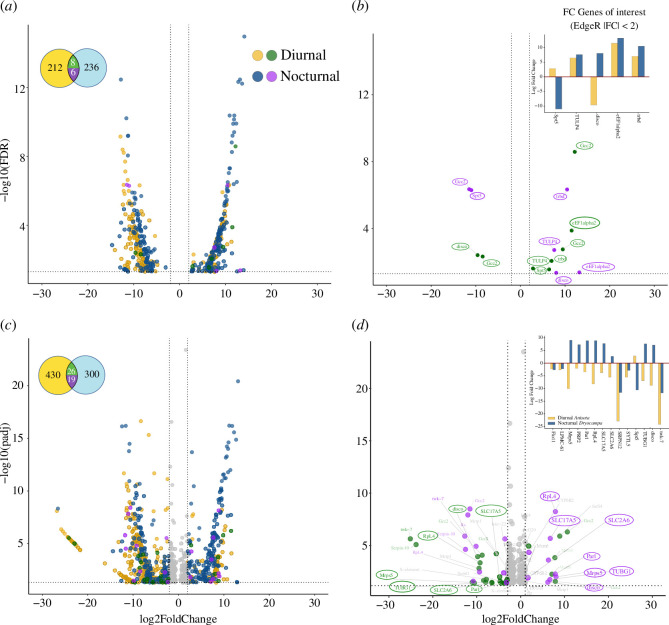
Figure 2.
Nocturnal and diurnal species show divergent patterns of gene expression with different analytical approaches (a,c): Left panels display volcano plots illustrating fold change and adjusted p-values for the significant differentially expressed genes between samples collected at midday and midnight for EdgeR (a) and DESeq2 (c). Circles at the upper left corner of (a) and (c) represent the number of genes expressed in both species and colours correspond to FC values for those genes in volcano plots. Yellow and blue represent genes expressed only in the nocturnal or diurnal species, green/purple indicates DEGs present in both species. (b,d) Right panels display only genes expressed in both species for EdgeR (b) and DESeq2 (d). Genes that display opposite trends in expression are highlighted and displayed in the boxplot inset in the upper left corner. Positive fold change indicates night overexpression and negative fold change indicates day overexpression. Genes had false discovery rate (FDR) or adjusted p‐value < 0.05 and −2 < FC < 2. Gene names and annotations are from B. mori.

