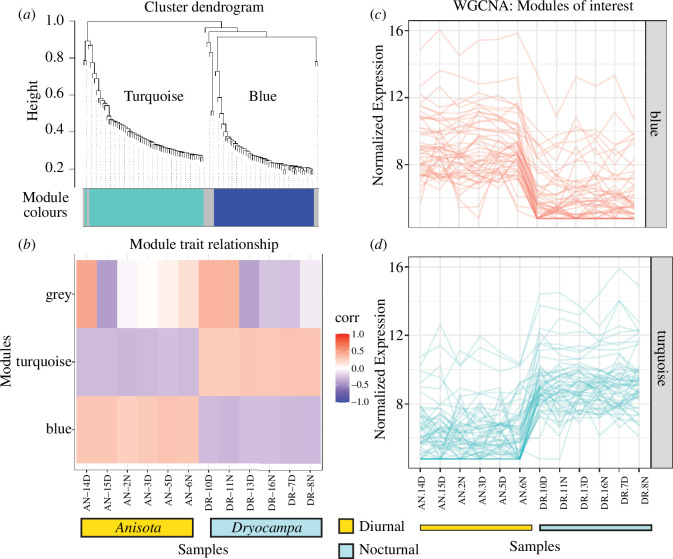
Figure 3.
Modules of clustered co-expressed genes grouped using normalized expression. (a) Dendrogram showing WGCNA clusters. (b) Patterns of gene expression correlate across samples and modules. (c) Normalized expression for all genes across samples. Two sets of 50 genes (blue) and (turquoise) have clear species-specific expression patterns. Normalization was done with DESeq2 and reads were mapped to the more stringently filtered transcriptome. A soft power analysis was conducted and a power of 9 was used for the WGCNA analysis. AN: Anisota, DR: Dryocampa. D and N represent different samples collected at day and night time points.

