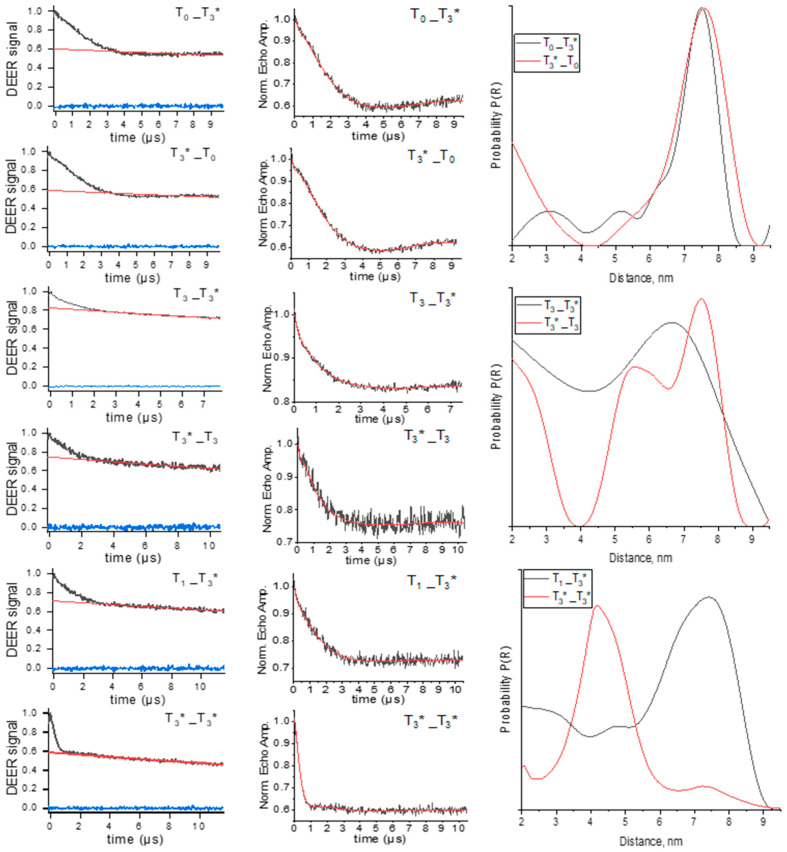
Figure 3.
Q-band PELDOR results for T0_T3*, T3*_T0, T1_T3*, T3_T3*, T3*_T3, and T3*_T3*. * means spin-labeled oligonucleotide. Left: PELDOR time traces (black) with the background fits (red) and an imaginary part of the signal (blue). Middle: Background-corrected PELDOR time trace (black) and Tikhonov fit (red). Right: The normalized distance distributions P(R) are obtained by Tikhonov regularization. For comparison, the data assessed by the DEERNet network using DeerAnalysis2022 software with uncertainty of distance are presented in Figure S5.

