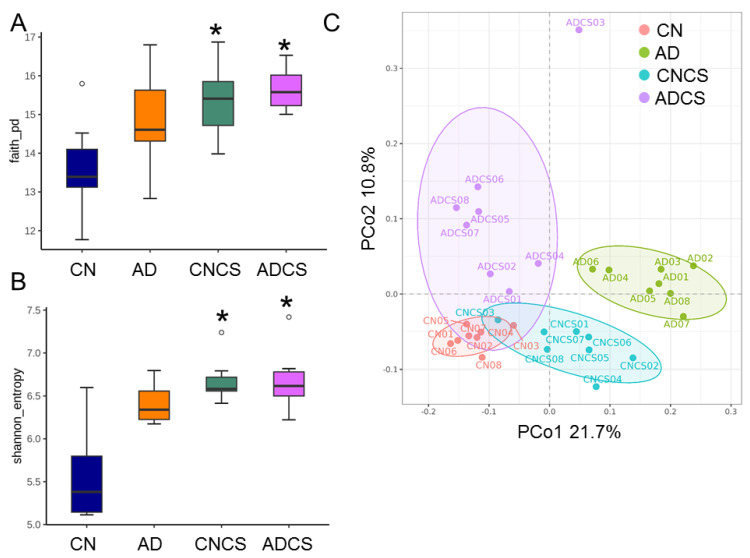
Figure 3.
Box plots were generated to illustrate (A) Faith’s phylogenetic diversity (PD) index and (B) Shannon index, depicting alpha diversity. * p < 0.05 by the Wilcoxon test. Outliers are denoted by dots. (C) Principal coordinate analysis (PCoA) plots were used to visualize beta diversity, with each data point representing one sample and each color corresponding to a different group. CN = standard diet; AD = standard diet containing 0.5% adenine; CNCS = standard diet containing 3% chondroitin sulfate; ADCS = standard diet containing 0.5% adenine plus 3% CS.

