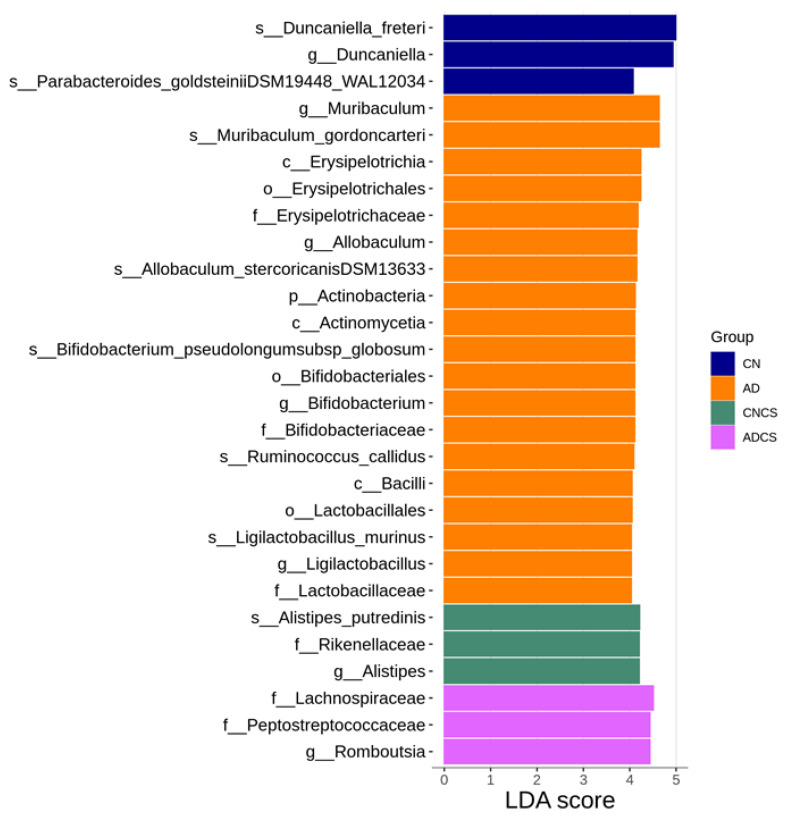
Figure 4.
Linear discriminant analysis effect size (LEfSe) was employed to identify taxa that were significantly differentially abundant between groups. Taxa with a linear discriminant analysis (LDA) score greater than 4 were primarily highlighted. The color of the horizontal bar represents the respective group. CN = standard diet; AD = standard diet containing 0.5% adenine; CNCS = standard diet containing 3% chondroitin sulfate; ADCS = standard diet containing 0.5% adenine plus 3% CS.

