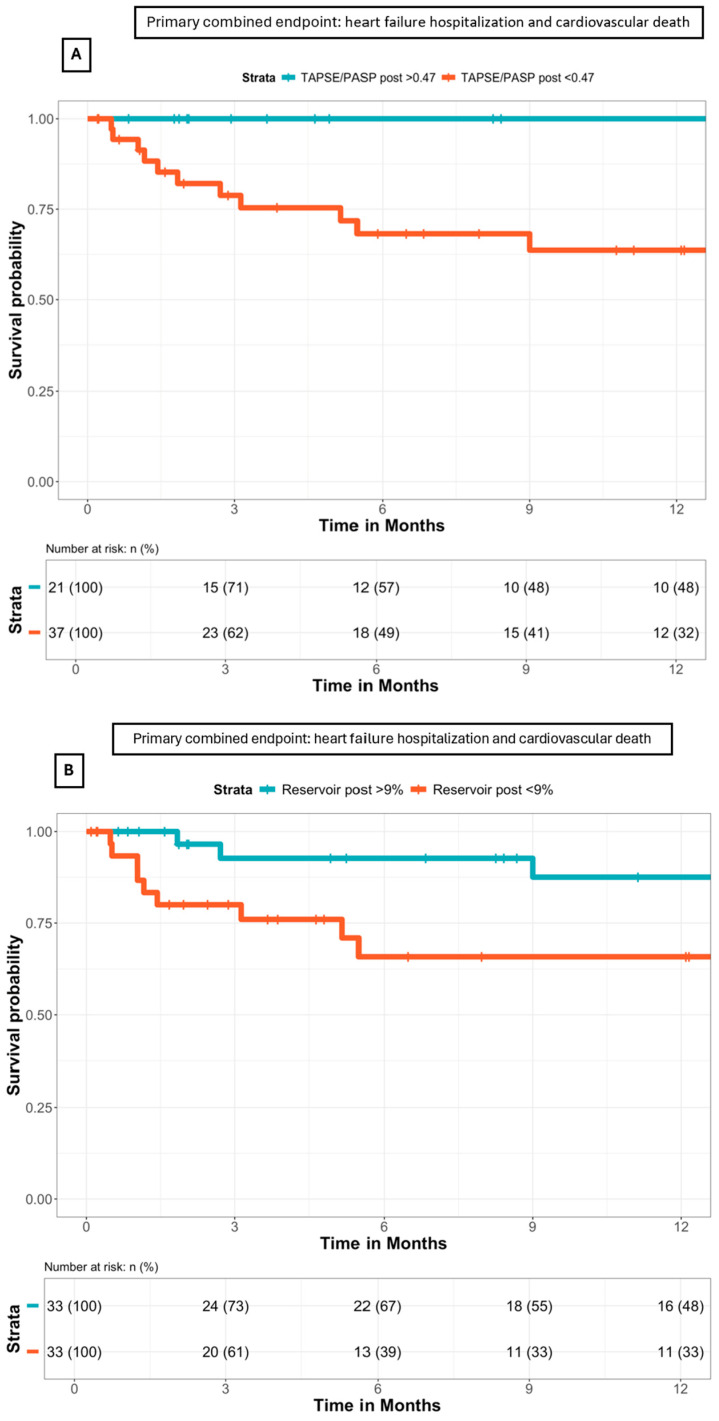
Figure 6.
(A) Survival analysis according to the post-TEER TAPSE/PASP ratio, as shown by Kaplan–Meier curves. A post-TEER TAPSE/PASP ratio of <0.47 was associated with higher rates of the primary composite endpoint (p-value = 0.039). (B) Survival analysis according to the post-TEER LA reservoir, as shown by Kaplan–Meier curves. An LA reservoir of <9.0% was associated with higher rates of the primary composite endpoint (p-value = 0.047).

