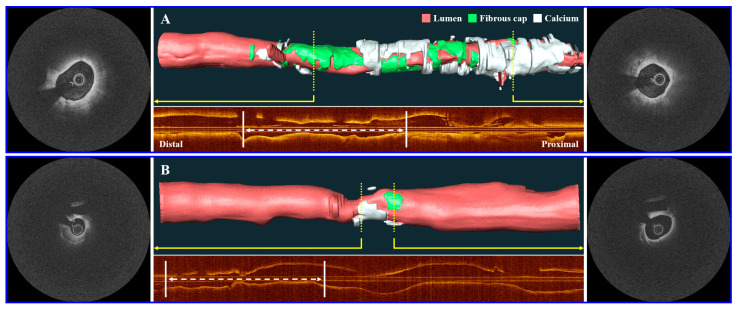
Figure 5.
Three-dimensional (3D) visualization of high-risk and low-risk lesions on representative IVOCT pullbacks. The top panel (A) depicts a high-risk lesion with a maximum calcium thickness of 1.32 mm and an FC surface area of 39.10 mm2. The bottom panel (B) illustrates a low-risk lesion with a maximum calcium thickness of 0.72 mm and an FC surface area of 1.63 mm2. Subsequently, the high-risk case experienced a CV death, while the low-risk case remained event-free. The corresponding IVOCT image frames are displayed alongside the 3D vessel maps (indicated by yellow arrows). The corresponding longitudinal IVOCT maps are provided below each case, with white arrows indicating the location of the lesion where the stent was implanted. The lumen is represented in red, the FC in green, and the calcium in white.

