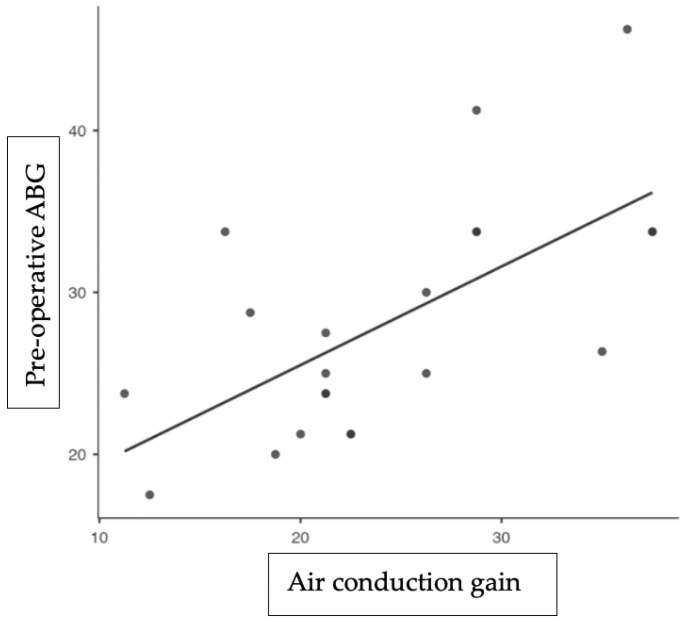
Figure 1.
This is a graph illustrating linear regression. Each dot on the graph represents one patient. The y-axis represents the pre-operative air–bone gap (in dB), while the x-axis represents the post-operative air-conduction gain (in dB). The continuous line illustrates the optimal alignment between the two values, indicating a full restoration of the ABG. As the point moves closer to the continuous line, the ABG shows a more significant recovery.

