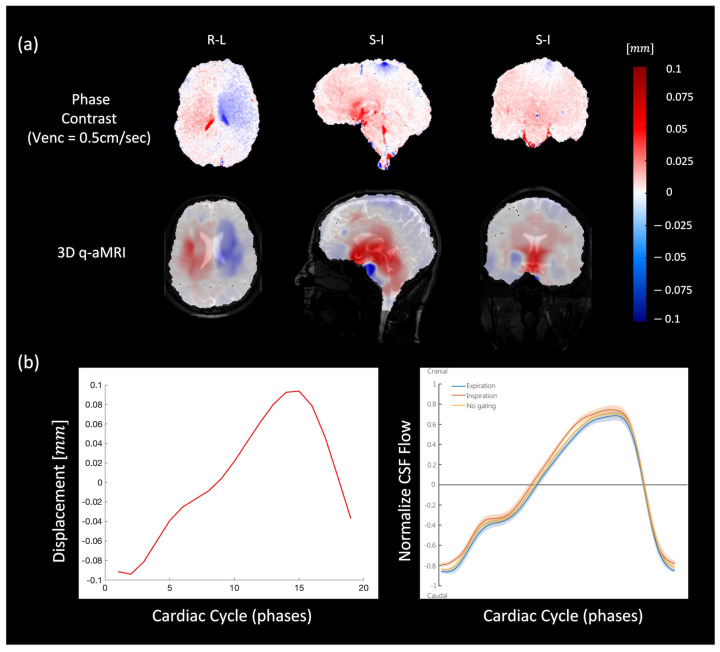
Figure 8.
(a) Comparison between PC-MRI (top) and 3D q-aMRI (bottom) for sagittal (S/I direction), coronal (S/I direction), and axial (L/R direction) planes. The estimated field captures the relative brain tissue deformation over time and the physical change in shape of the ventricles by the relative movement of the surrounding tissues. (b) The extracted flow/motion profile through the cerebral aqueduct as extracted by 3D q-aMRI (left), which is comparable to that reported by [46] as shown in the inset (right). Note that [46] the graph seen here is normalized, but the actual CSF flow values reported were an order of magnitude higher than the 3D q-aMRI flow profile.

