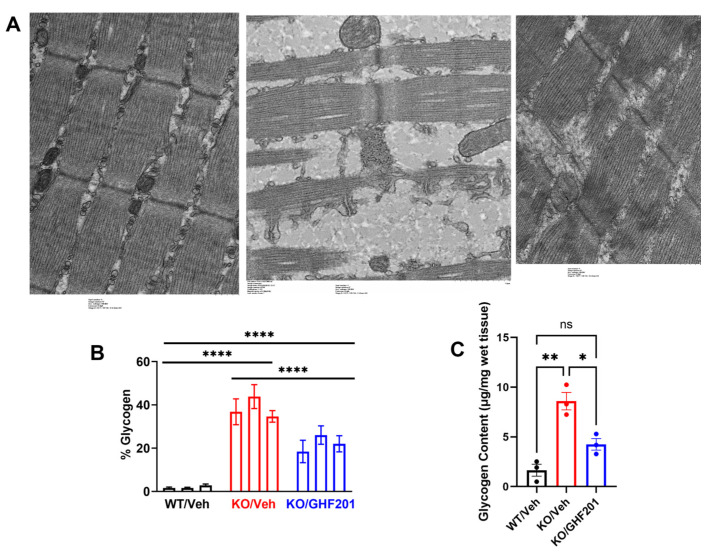
Figure 5.
(A) Representative transmission electron microscopy images of longitudinal sections of gastrocnemius muscle collected from 8-month-old animals treated as indicated. Note granular glycogen material interspersing sarcomeres in the section from untreated Agl−/− mouse. Also note variable width of sarcomeres in Agl−/− mouse sample. These ultrastructural phenotypes were partially corrected in GHF-201-treated Agl−/− mouse. (B) Quantification of area percent of glycogen based on analysis of TEM images from n = 3 animals. ****, significant differences between arms (p < 0.0001, Two Way ANOVA (factors are “animal” and “arm”) with Tuckey post hoc correction). (C) Biochemical quantification of Gastrocnemius glycogen. Glycogen levels in muscle tissues collected from n = 3 mice/arm were determined by Merck’s glycogen assay kit and statistically analyzed by One Way ANOVA with Tuckey post hoc correction. *, p < 0.05; **, p < 0.01, ns, p < 0.08.

