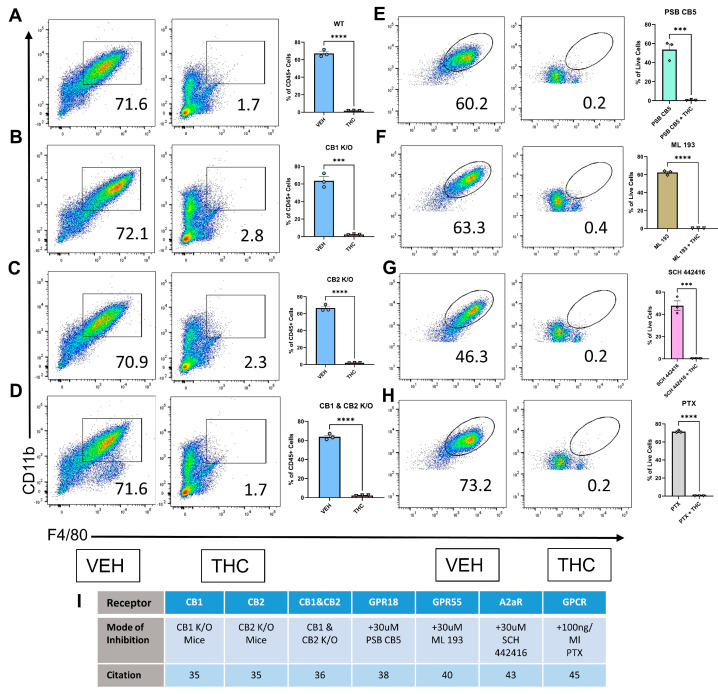
Figure 2.
Identifying potential receptors through which THC blocks macrophage differentiation. (A–H) Representative flow and graphical representation of macrophage populations at 120 h between VEH- and THC-treated groups. Y-axis on flow plot is CD11b; X-axis is F4/80. (A–D) Preliminary flow gating shown in Figure S1A. (E–H) Preliminary flow gating shown in Figure S1B. (A) Wild-type mice; (B) CB1 knockout mice; (C) CB2 knockout mice; (D) CB1 and CB2 knockout mice; (E) GPR18 antagonist PSB CB5; (F) GPR55 antagonist ML 193; (G) A2aR antagonist SCH 442416; (H) G-PCR inhibitor PTX; (I) List of receptor inhibition methods and related citation. (A–H) n = 3, unpaired t-test was performed, levels of statistical significance were assigned according to the following cutoffs: *** p < 0.001, and **** p < 0.0001.

