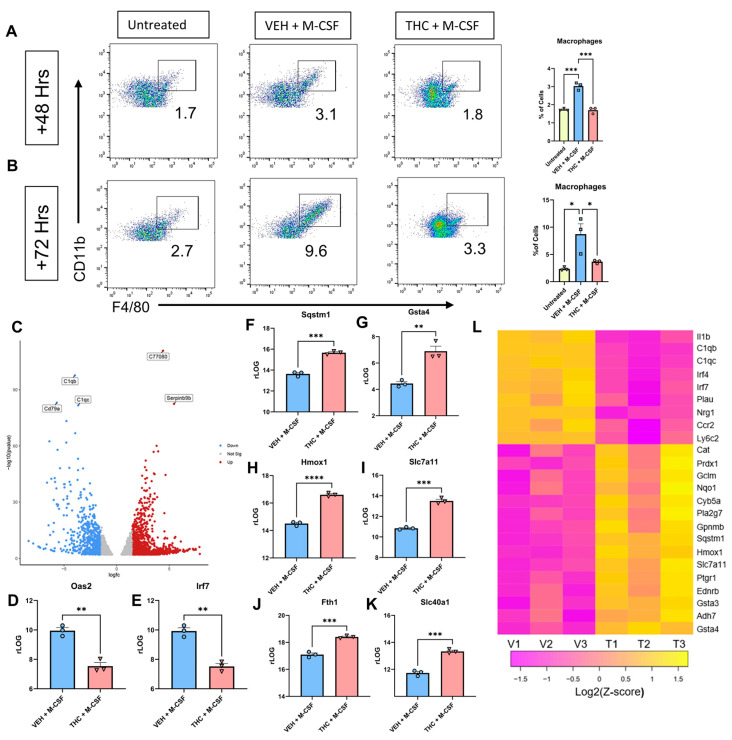
Figure 3.
Analysis of BMDCs 48 h after culture with M-CSF. (A) Representative flow cytometry pseudocolor plot and graphical representation of CD45 + CD11b + F4/80+ macrophages at 48 h. Preliminary gating shown in Figure S1C. (B) Representative flow cytometry pseudocolor plot and graphical representation for CD45 + CD11b + F4/80+ macrophages at 72 h. Preliminary gating shown in Figure S1D. (C) Volcano plot of DEGS between VEH + M-CSF- and THC + M-CSF-treated groups at 48 h. (D,E) Graphical representation of rLOG normalization counts for VEH + M-CSF- and THC + M-CSF-treated groups at 48 h. (F–K) Graphical representation of rLOG normalization counts for ARE and iron-related genes between VEH + M-CSF- and THC + M-CSF-treated groups at 48 h. (L) Heat map of DEGs between VEH + M-CSF- and THC + M-CSF-treated groups at 48 h. (A,B,D–I) n = 3, levels of statistical significance were assigned according to the following cutoffs: * p < 0.05, ** p < 0.01, *** p <0.001, and **** p < 0.0001. (D–I) Unpaired t-test was performed between the two groups.

