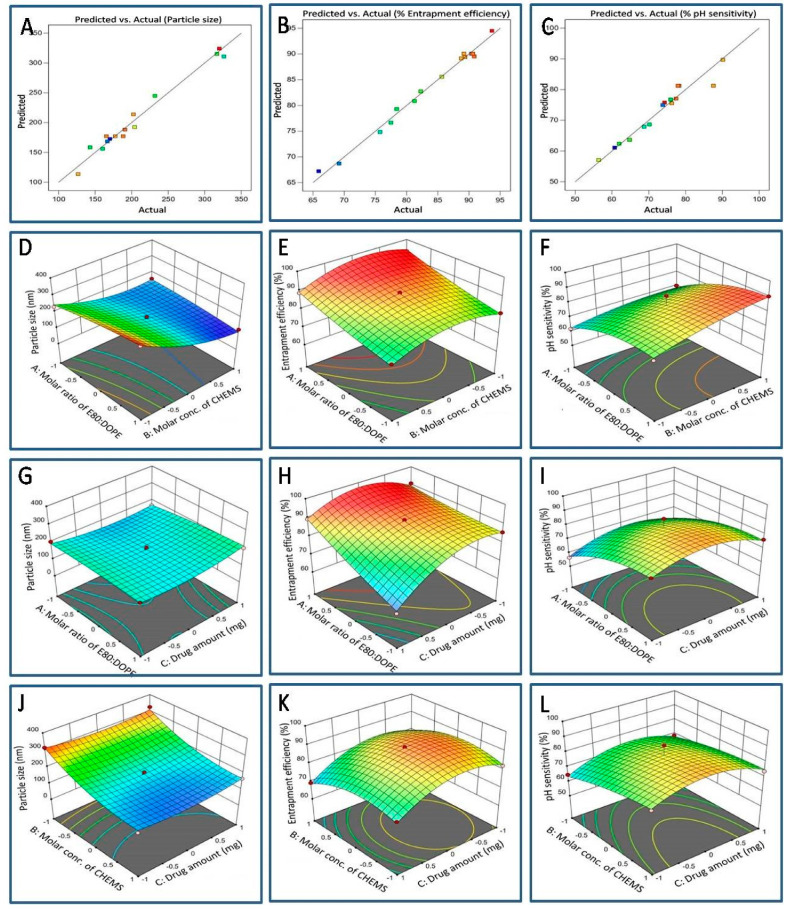
Figure 1.
Panels (A–C) depict linear correlation plots illustrating the relationship between predicted and actual values for particle size, % entrapment efficiency, and % pH sensitivity, respectively. Panels (D–F) display surface response 3D plots demonstrating the impact of the molar ratio of E80:DOPE and molar concentration of CHEMS on particle size, % entrapment efficiency, and % pH sensitivity, respectively. Panels (G–I) show surface response 3D plots illustrating the impact of the molar ratio of E80:DOPE and the amount of drug on particle size, % entrapment efficiency, and % pH sensitivity, respectively. Panels (J–L) display surface response 3D plots showcasing the effect of the molar concentration of CHEMS and the amount of drug on particle size, % entrapment efficiency, and % pH sensitivity, respectively.

