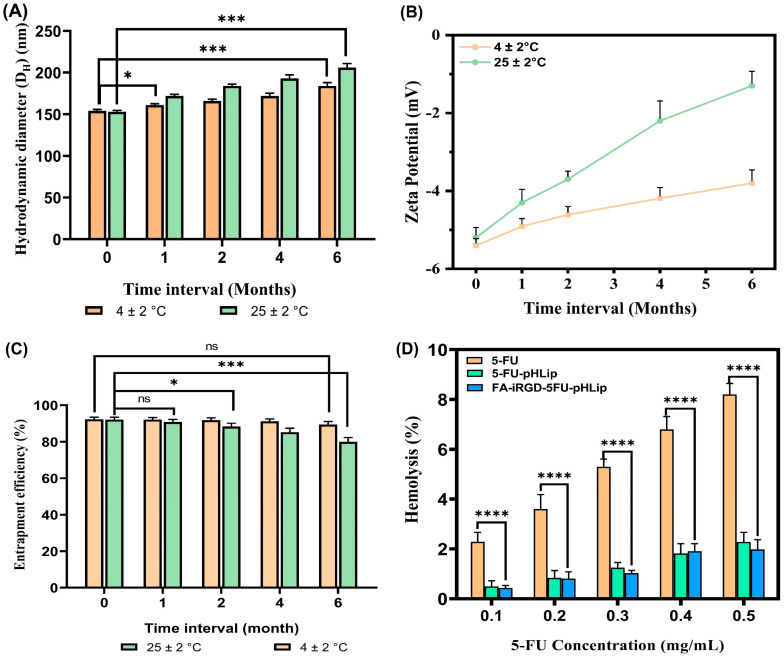
Figure 11.
Storage stability data in terms of the mean particle size (A), zeta potential (B), and entrapment efficiency (C) up to 6 months: % hemolysis plots of plain 5-FU solutions and liposomal formulations at various 5-FU concentrations (D). Data are expressed by the mean (n = 3) ± SD. [One asterisk (*), three asterisks (***), and four asterisks (****) denote significant p values, i.e., <0.05, <0.001 and <0.0001, respectively, and ns as non-significant].

