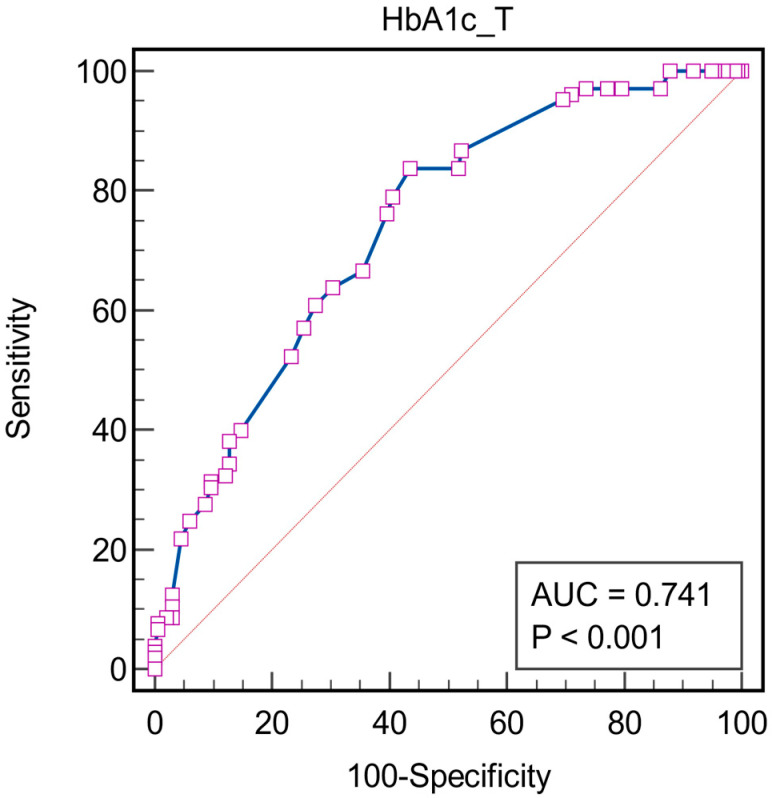
Figure 5.
Receiver operating characteristics analysis for HbA1c as a predictor for DR. Associated criterion: HbA1c > 7.2%, AUC = 0.741; Youden index J: 0.4015 95%, CI: 0.688 to 0.790; Sensitivity: 83.81%, z statistic = 8.417; Specificity: 56.36%, p < 0.0001. The squares represent individual data points, the blue line represents the ROC curve and the red diagonal line is the reference line that represents a model with no discriminative ability.

