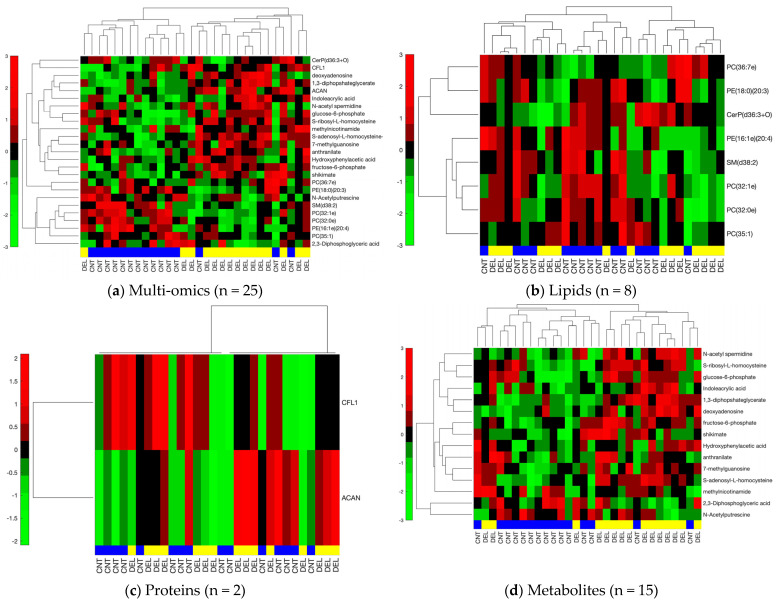
Figure 3.
Hierarchical clustering for lipid, metabolite, protein, and combined omics signatures. The blue and yellow horizontal bars denote control (CNT) and delirium (DEL) samples, respectively. Red and green represent up- and downregulation in the delirium group, respectively. The vertical side bar represents the range of row-normalized (zero-mean, unit-variance) signal values and corresponding color codes. (a) Combined multi-omics signature (25 molecules), (b) Lipidomic signature (8 lipids), (c) Proteomic signature (2 proteins), (d) Metabolomic signature (15 metabolites).

