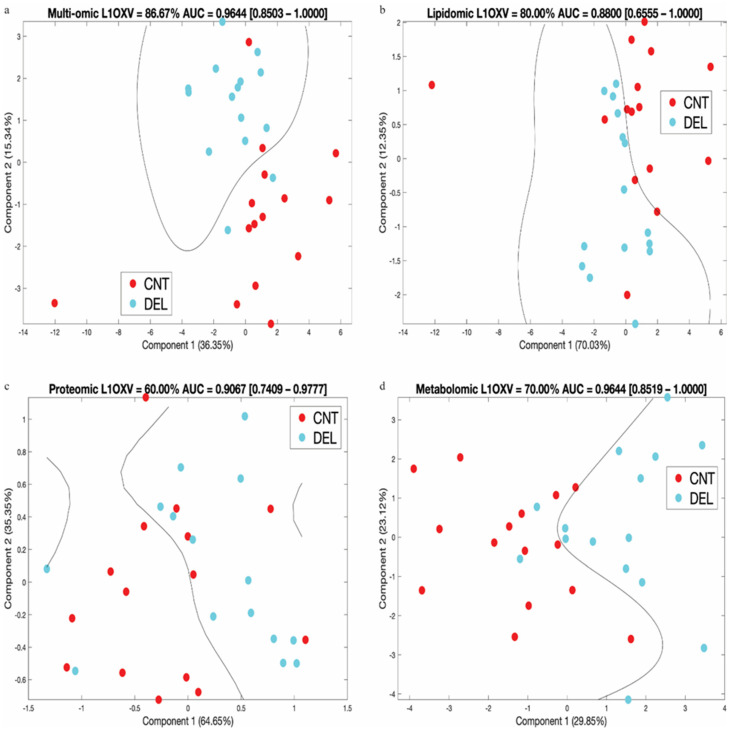
Figure 4.
For each signature, leave-one-out cross-validation (L1OXV) accuracy and area under the curve (AUC) of the receiver operating characteristic (ROC) curve are noted. In brackets, we note the 95% confidence interval for the AUC values. (a) Combined multi-omics signature (25 molecules), (b) Lipidomic signature (8 lipids), (c) Proteomic signature (2 proteins), (d) Metabolomic signature (15 metabolites). Percent values along the axes represent the percent of variation in data explained by the respective principal component.

