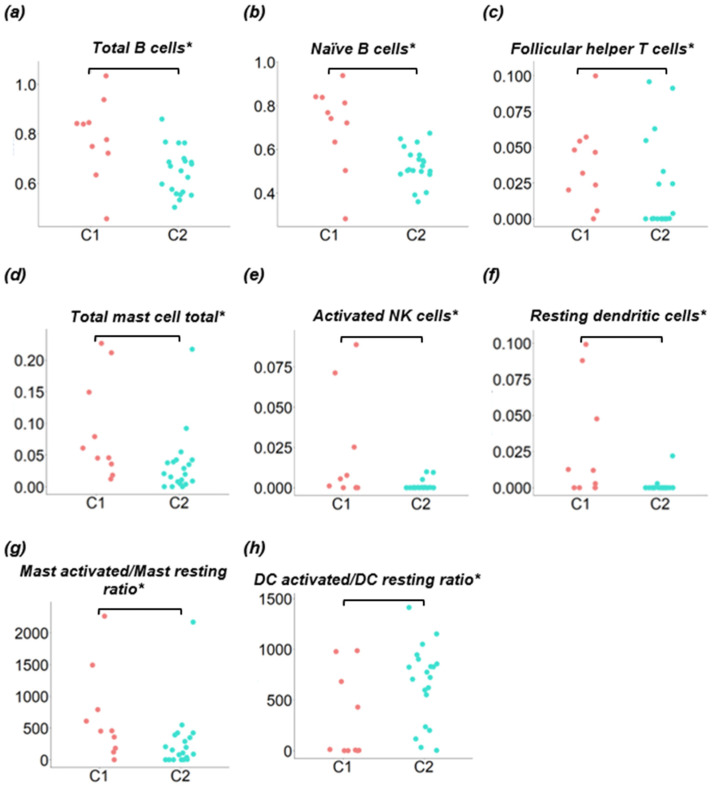
Figure 6.
Comparison of immune cell populations between clusters C1 and C2. CIBERSORTx immune cell fractions were determined for each sample; each dot represents one sample. The x-axis refers to the clusters being compared (C1 and C2) and the y-axis represents the CIBERSORTx cell population scores. * p < 0.05.

