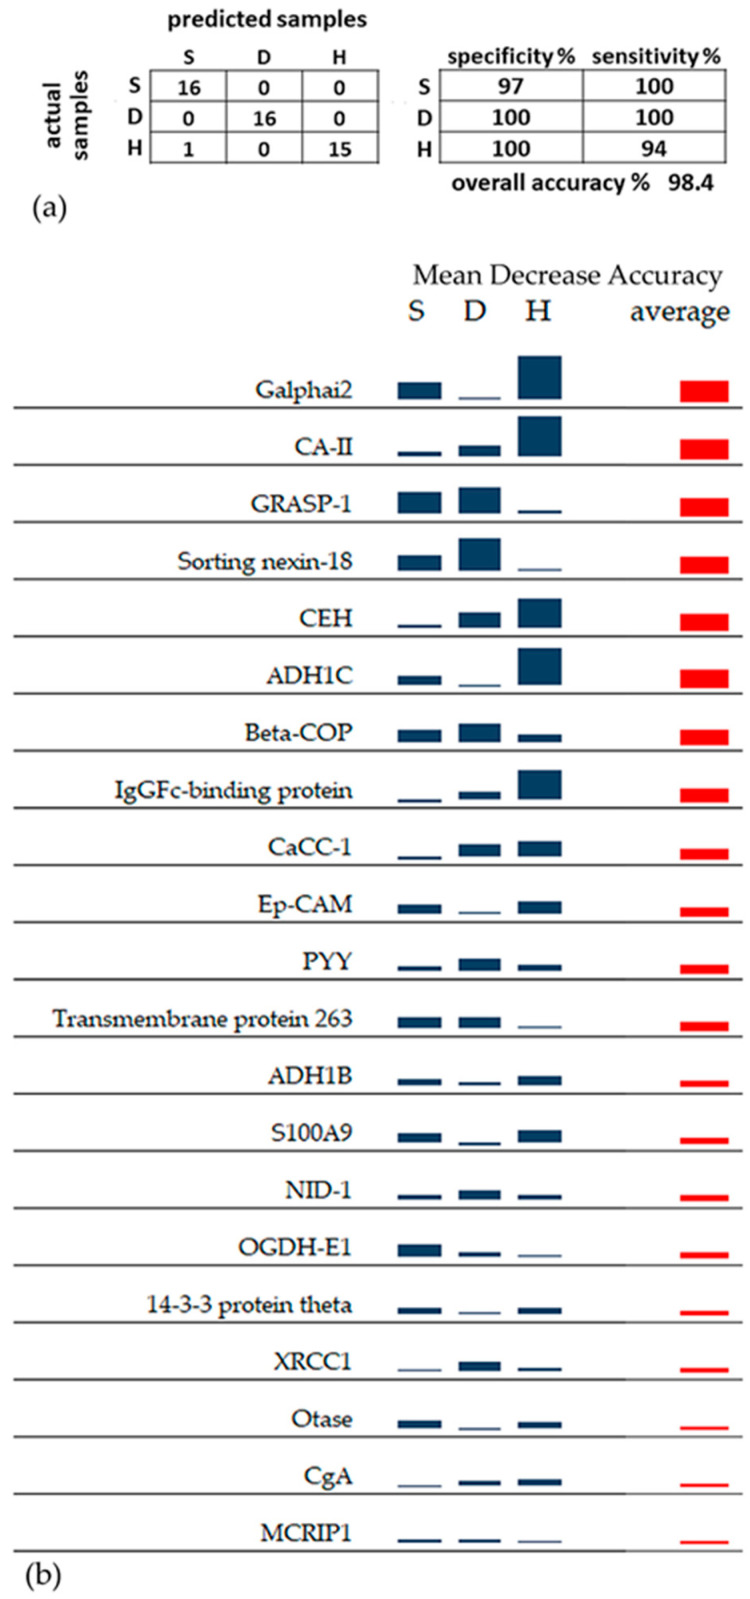
Figure 1.
(a) Confusion matrix and sensitivity/specificity of RF classification. (b) Sparkline graphic representing the relative importance of the 21 proteins selected for RF classification of the S, D, and H groups, calculated as MDA. Proteins with a higher average MDA have a greater importance in the RF model. Blue columns show the MDA scores calculated for each group. The red column shows the average MDA score.

