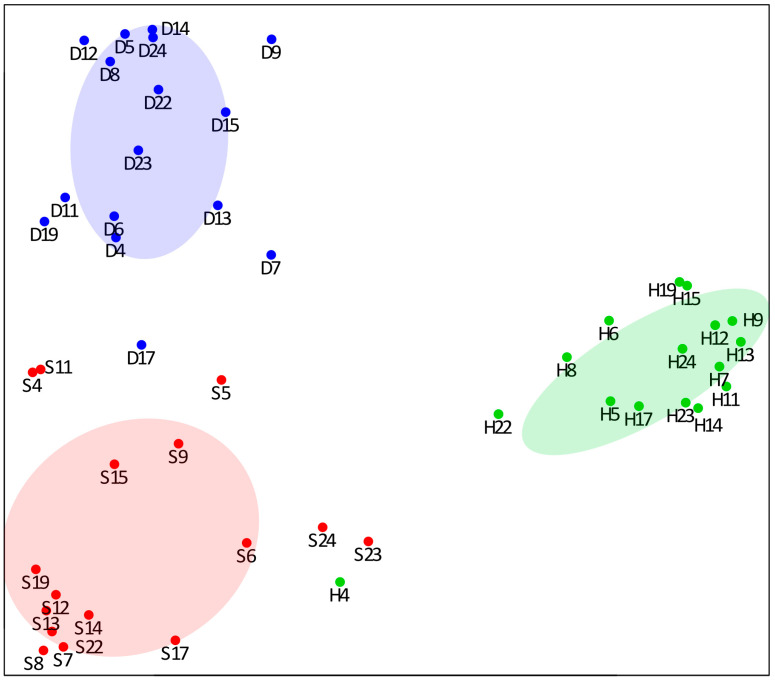
Figure 2.
Multidimensional scaling plot showing the relationships among the three groups of samples (S, red; D, blue; H, green), using the proximity values calculated by RF. Patient identification numbers correspond to those shown in Table 1. Each group is delimited by a dispersion ellipse with a confidence of 1.6 standard deviations.

