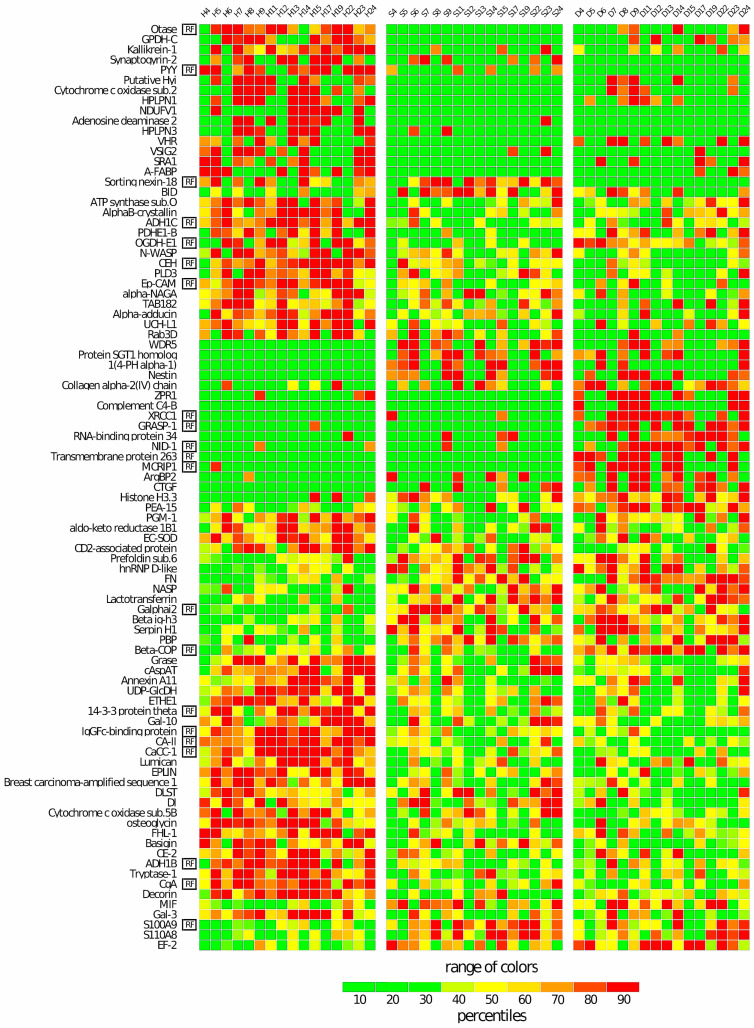
Figure 3.
Heatmap of the 91 proteins showing significant changes among the three groups of samples. Each row of the heatmap represents a specific protein, and each column represents a single subject. The “RF” labels indicate the 21 proteins used for RF classification. For each protein, the color of each cell reflects the percentile value of each subject relative to all 48 subjects present in the same row. Shades of green and red represent decreasing and increasing percentiles, respectively, from the median. To obtain homogeneous blocks of color, the proteins were preliminarily ordered vertically based on the output of a hierarchical cluster analysis. Note that the 21 RF proteins are spread across all the major clusters produced by the 91 differentially expressed proteins. This suggests that the RF proteins span the full range of the different relationships among the proteins found to be varied among the three groups.

