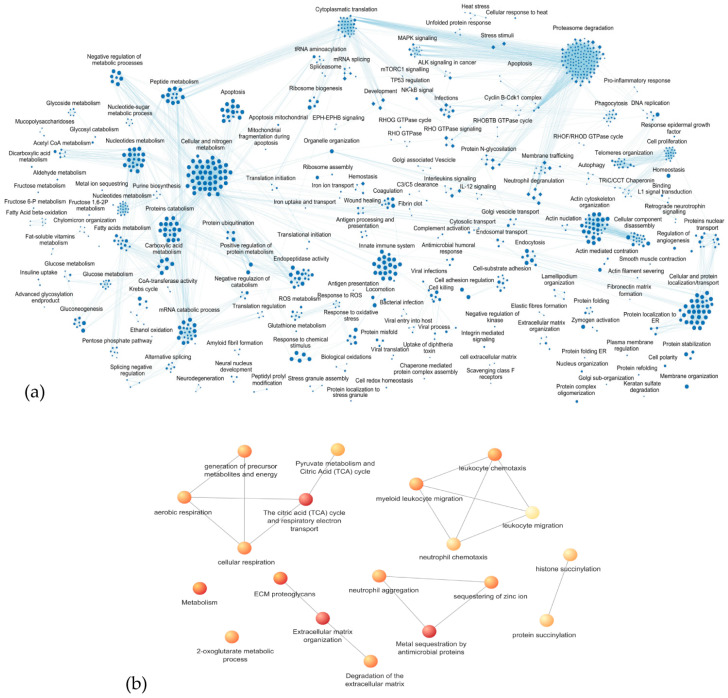
Figure 4.
Enrichment analysis via g:Profiler coupled with Cytoscape EnrichmentMap Pipeline Collection of the following: (a) of all the 2009 proteins identified in the study, only functional networks defined by the processes with p-values < 0.01 are shown; (b) the 91 proteins showing significant variations in the statistical differential analysis. Colors refer to FDR, from the least significant (light yellow, FDR 0.04) to the most significant (red, FDR 0.002).

