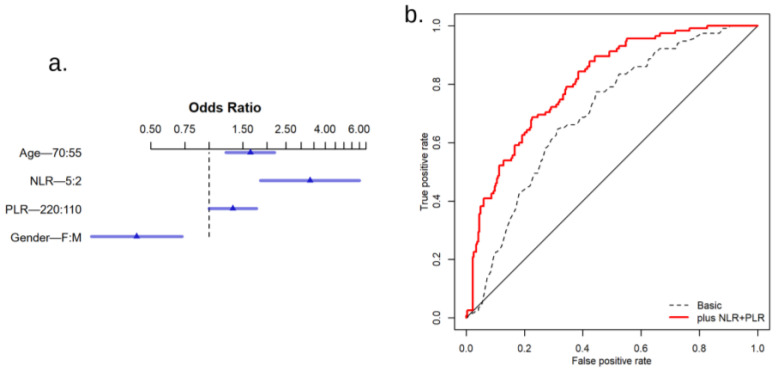
Figure 4.
Predictive model for the presence of lung cancer in patients with pulmonary disease (a). Odds ratios (triangles) and their 95% confidence intervals (horizontal bars) for the components of the predictive model: Age, Gender, NLR, and PLR (b). Receiver operating characteristic (ROC) curves for a basic model (based on Age and Gender only) and the complete model (based on Age, Gender, NLR, and PLR) based on multiple logistic regression for the prediction of the presence of lung cancer. The closer the curve to the top-left corner of the chart, the more accurate the distinction between a patient with and a patient without cancer.

