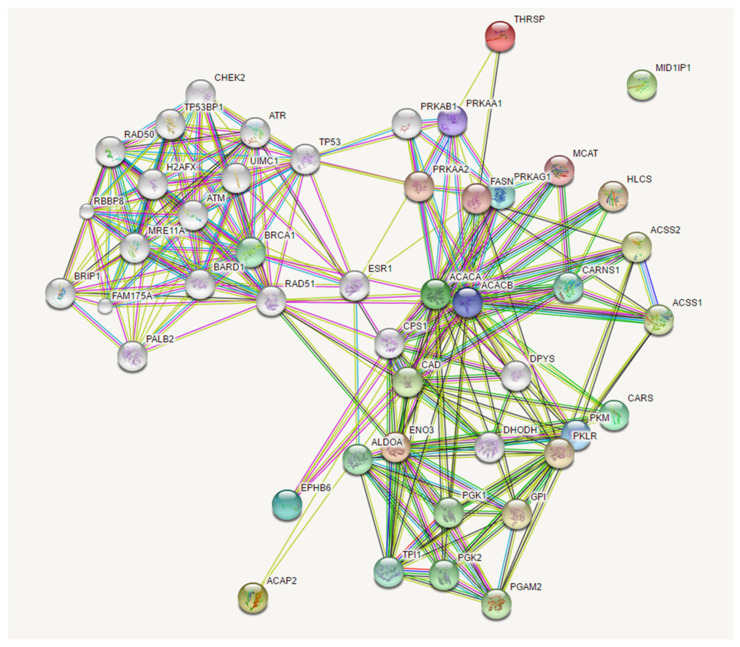
Figure 6.
Expanded network among EPHB6, ACACA, ENO3, CARS, and ACAP2 genes. Network nodes (colored spheres) represent proteins (empty nodes = proteins of unknown 3D structure; filled nodes = a 3D structure is known or predicted). Straight lines connecting the nodes represent protein–protein associations (light blue lines = known interactions from curated databases; purple lines = known experimentally determined interactions; dark green lines = predicted interactions such as neighborhood gene; light green = predicted interactions by text mining; black lines = co-expression; dark blue lines = gene co-occurrence; red lines = gene fusion).

