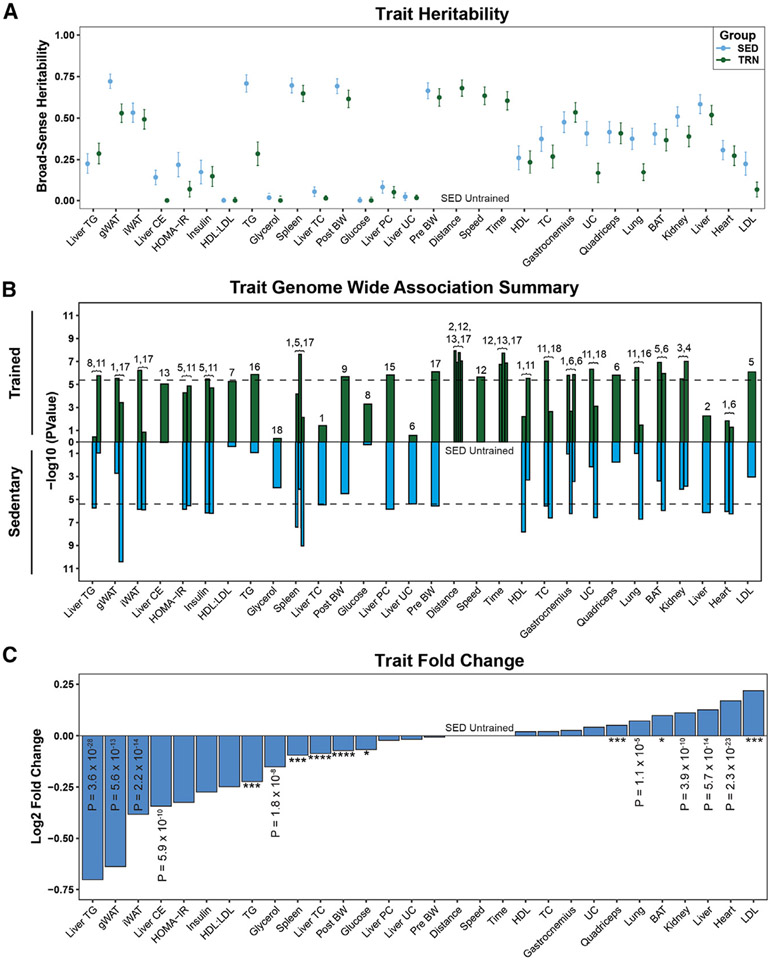
Figure 2. Trait heritability and the effect of genetic architecture on exercise adaptations.
(A) Heritability estimates of each trait for sedentary (blue) and exercise trained (green).
(B) Top QTLs from GWAS of each trait in sedentary (blue) and exercise-trained (green) animals. Chromosome location of QTL indicated above bar. Dashed lines indicate significance threshold (−log10(p value)).
(C) The log 2-fold change of traits across all strains relative to the sedentary group. *p < 0.05, ***p < 0.001, ****p < 0.0001.

