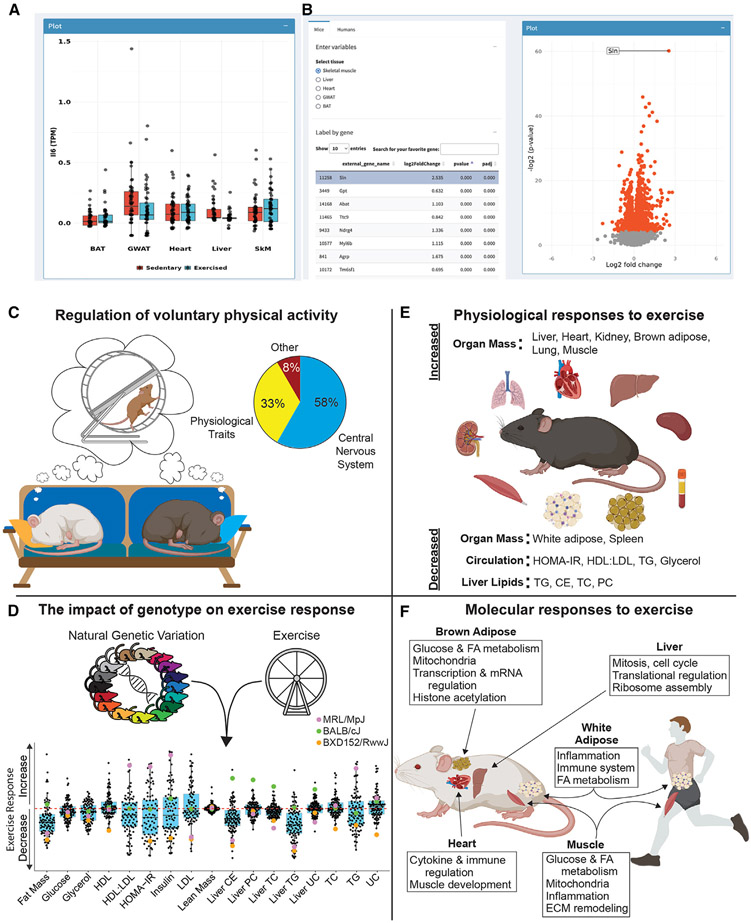
Figure 7. Overview of Shiny Web application and summary of findings.
(A) Screen shot of the Web application showing dot plots of transcriptomics data from BAT, gWAT, heart, liver, and skeletal muscle (SkM) of sedentary vs. exercised (trained) mice.
(B) Screen shot of time variable comparisons for human muscle transcriptomic findings in table format (left) and volcano plot (right). The website enables users to browse, mine, as well as download transcriptomics data from mice and humans.
(C–F) Summary of the main findings divided into four broad categories: (C–F) volitional exercise, (D) genotype-specific exercise response, (E) physiological responses to exercise intervention, and (F) molecular adaptations to repeated physical activity.

