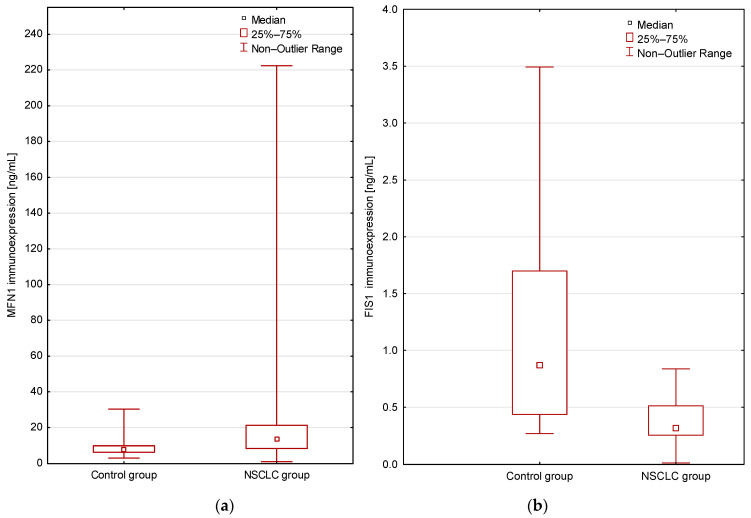
Figure 2.
(a) Comparison of the MFN1 immunoexpression levels in the study groups (patients vs. controls; p = 0.007 Mann–Whitney U test); (b) Comparison of the FIS1 immunoexpression levels in the study groups (patients vs. controls; p = 0.00006 Mann–Whitney U test). Mean immunoexpression levels of the studied proteins in serum are shown in Table 2.

