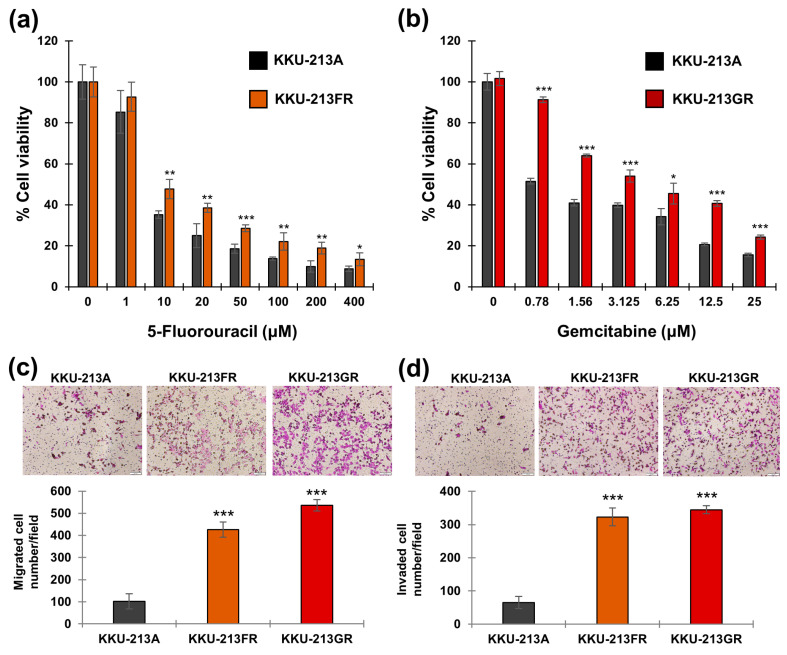
Figure 1.
Phenotypic study of drug-resistant CCA cell lines. Drug sensitivity assay of KKU-213FR (a) and KKU-213GR (b). (c) Cell migration assay. (d) Cell invasion assay: magnification 100×; scale bar, 100 μm. The data are presented as mean ± SD from three replicates. Significant differences between treated versus untreated controls or parental versus drug-resistant cells are indicated by * p < 0.05, ** p < 0.01, and *** p < 0.001.

