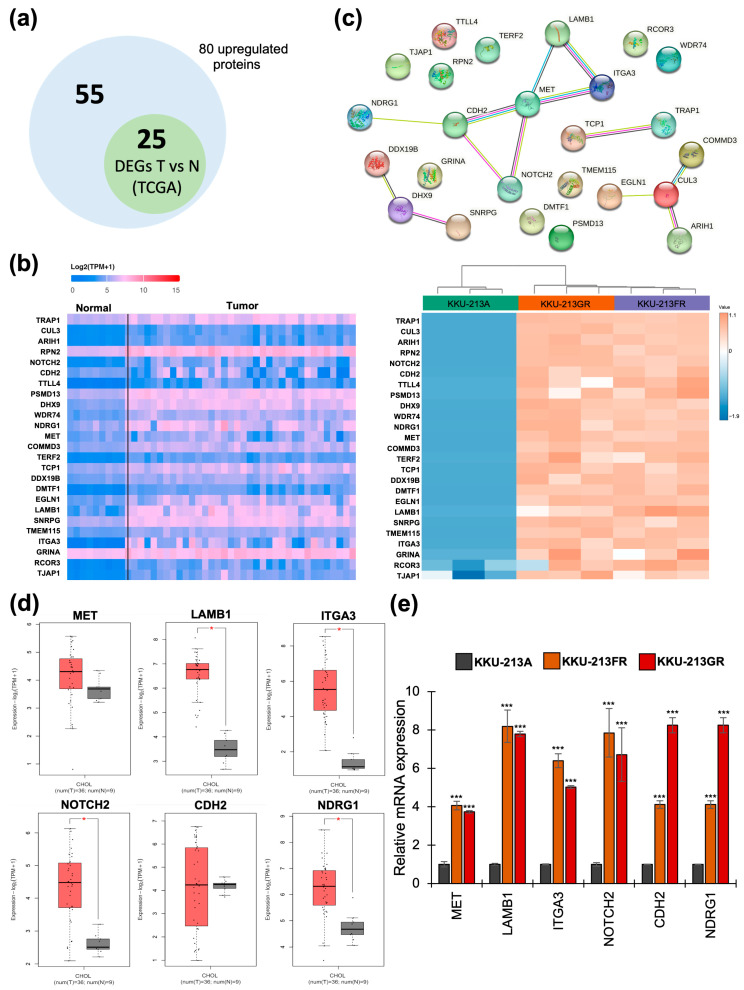
Figure 4.
Identification of significant genes in CCA. (a) The Venn diagram represents 80 upregulated proteins from the proteomic analysis and 25 upregulated genes in CCA tissue compared to normal tissue. (b) Heatmap analysis displaying the expression of 25 overlapping genes that were significantly upregulated in CCA patients’ tissues based on TCGA data (left) and proteomics data (right). (c) PPI analysis of the 25 upregulated genes via STRING. (d) Box plot showing the mRNA expression of six selected genes (a focused network) in CCA patients’ tissues (red box) vs. normal tissues (grey box) based on TCGA data. Significant differences between groups are indicated by * p < 0.05. (e) The mRNA expression of six selected genes verified by RT-qPCR in KKU-213A, KKU-213FR, and KKU-213GR. Significant differences between the KKU-213A and KKU-213FR groups, as well as between the KKU-213A and KKU-213GR groups, are indicated by *** p < 0.001.

