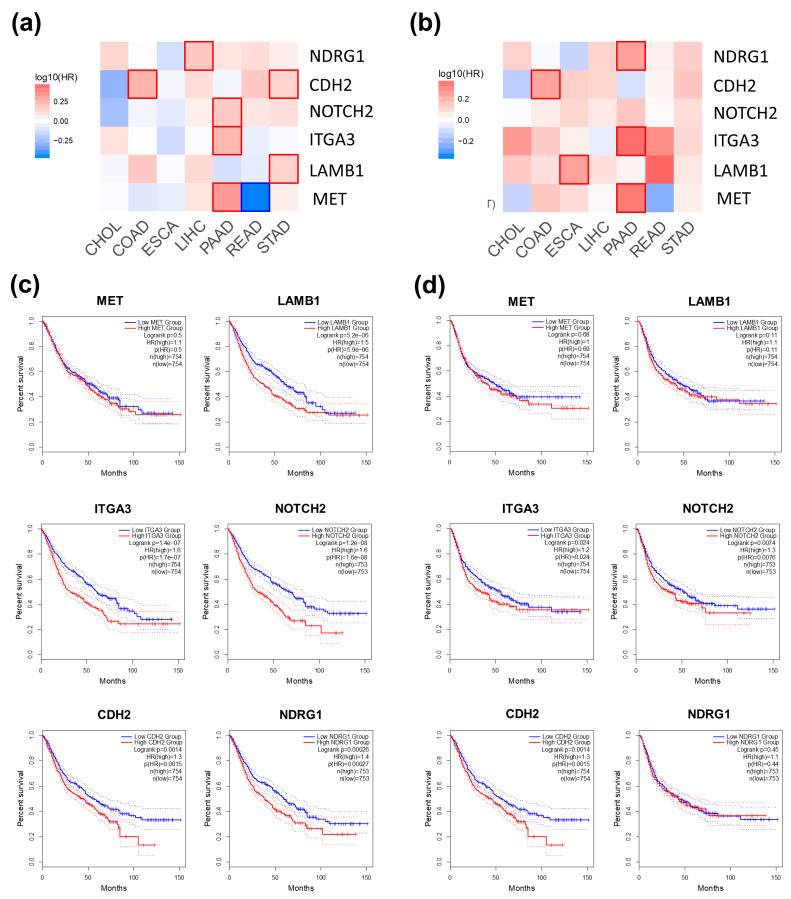
Figure 5.
Survival analyses of six selected genes in GI tract cancer patients. The overall survival map (a) and disease-free survival map (b) are displayed. Red shading indicates poor prognosis, and blue shading indicates good prognostic potential for each gene. The box with a prominent border represents statistical significance. Kaplan–Meier plots are used to represent overall survival (c) and disease-free survival (d).

