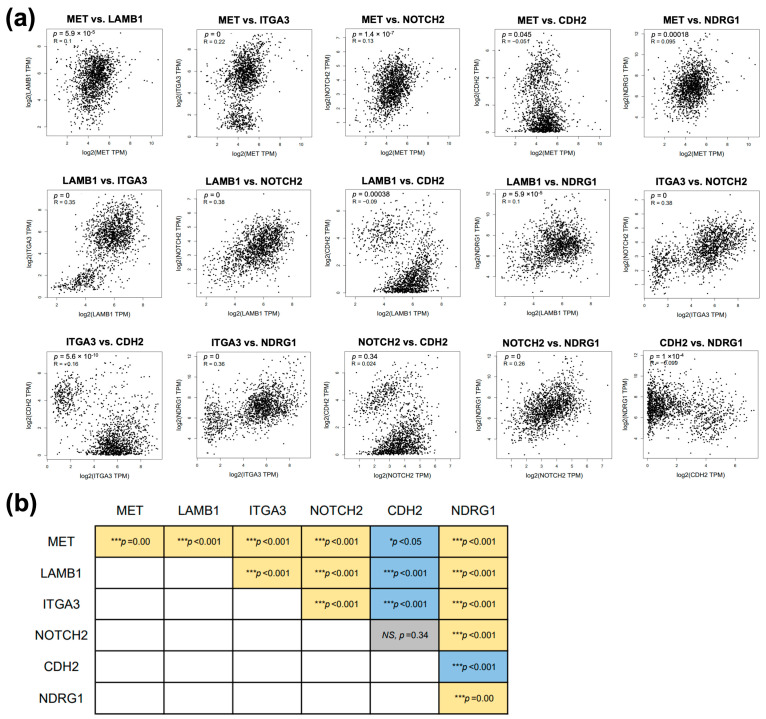
Figure 6.
The correlation analysis of six focused genes in GI tract cancers includes. (a) Scatter plots depicting the expression correlation between gene pairs in GI tract cancers. (b) Summary of the significant correlations among gene pairs in GI tract cancers. Yellow color indicates a positive correlation, blue color indicates a negative correlation, and grey color indicates no significant correlation between genes. Significant correlations between gene pairs are indicated by *** p < 0.001, while NS denotes non-significance.

