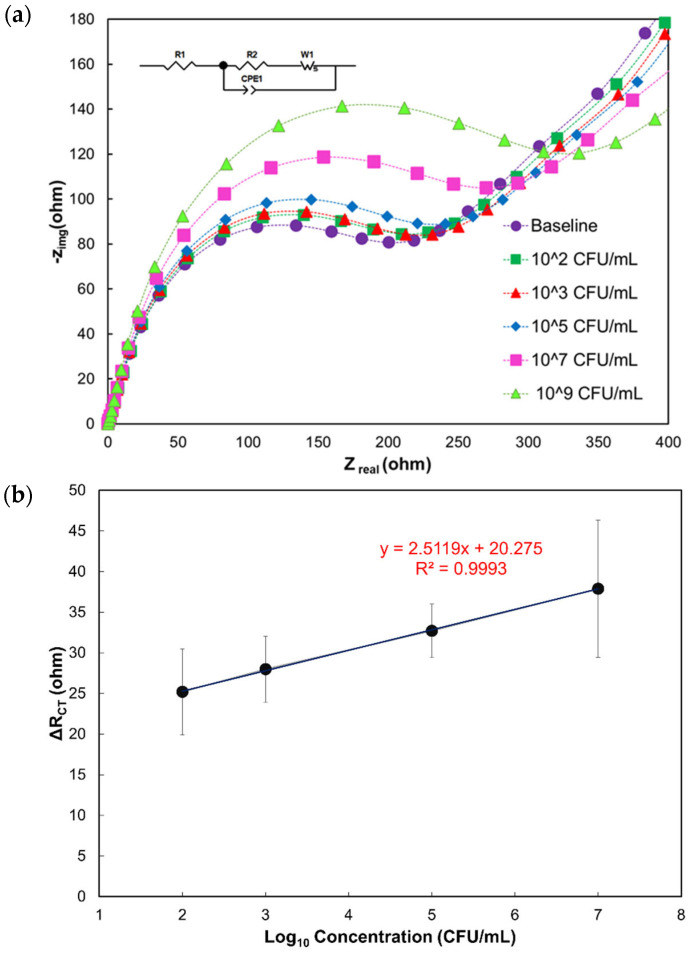
Figure 2.
(a) Nyquist plots show the impedance response to varying concentrations of the target analyte C. jejuni 11168. The equivalent electrical circuit used for fitting the Nyquist data is shown in the inset. (b) Calibration curve showing a linear relationship between the differential charge transfer resistance ΔRCT (ohm) and the logarithmic C. jejuni 11168 concentrations.

