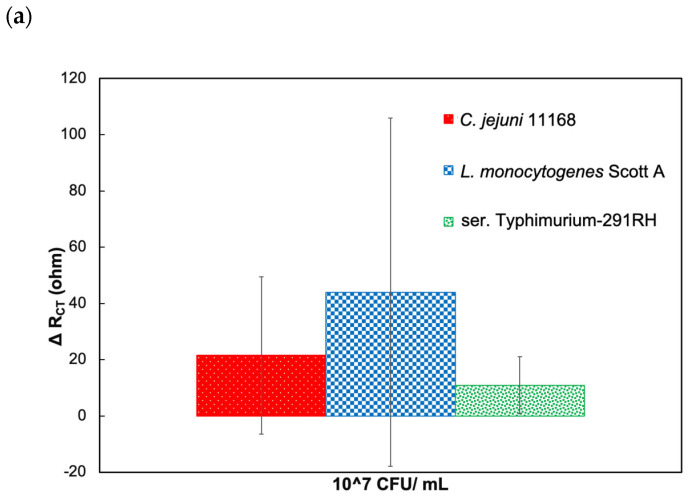
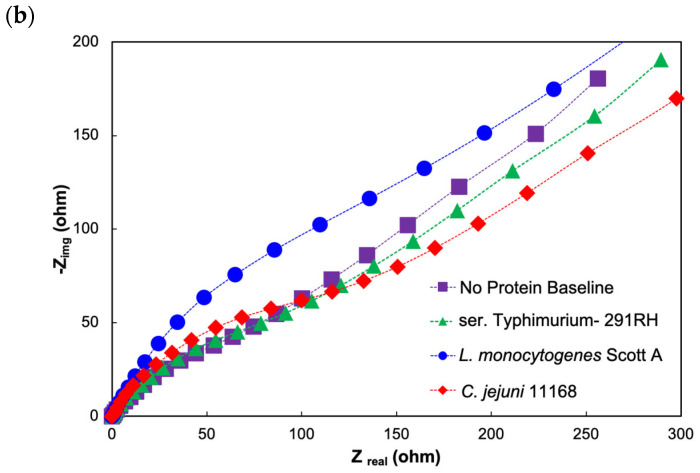
Figure 4.
Response to target and nontarget pathogens in the absence of phage protein. (a) ΔRCT (ohm) response values as the difference from baseline values when CC-FlaGrab is absent. (b) Nyquist plot of the impedimetric response to target and nontarget bacterial cells in the absence of CC-FlaGrab protein.


