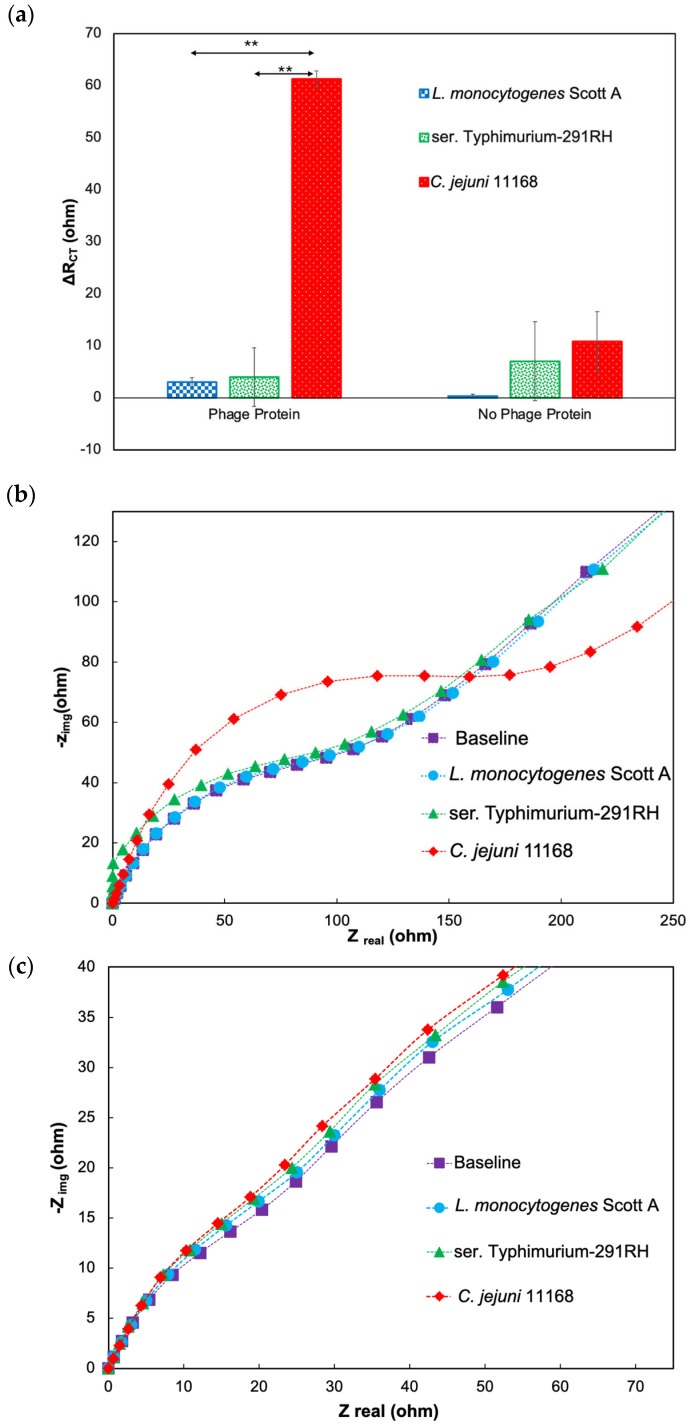
Figure 8.
Response to target and nontarget pathogens in chicken cecal samples in the presence and absence of phage protein. (a) ΔRCT (ohm) values of the response as the difference from baseline values with phage protein and no phage protein. (b) Nyquist plot of the impedimetric response to target and nontarget bacterial cells in the presence of phage protein. (c) Nyquist plot of the impedimetric response to target and nontarget bacterial cells in the absence of phage protein. The asterisk indicates statistical significance (** p < 0.01, using One way-ANOVA with Post-hoc Tukey HSD test).

