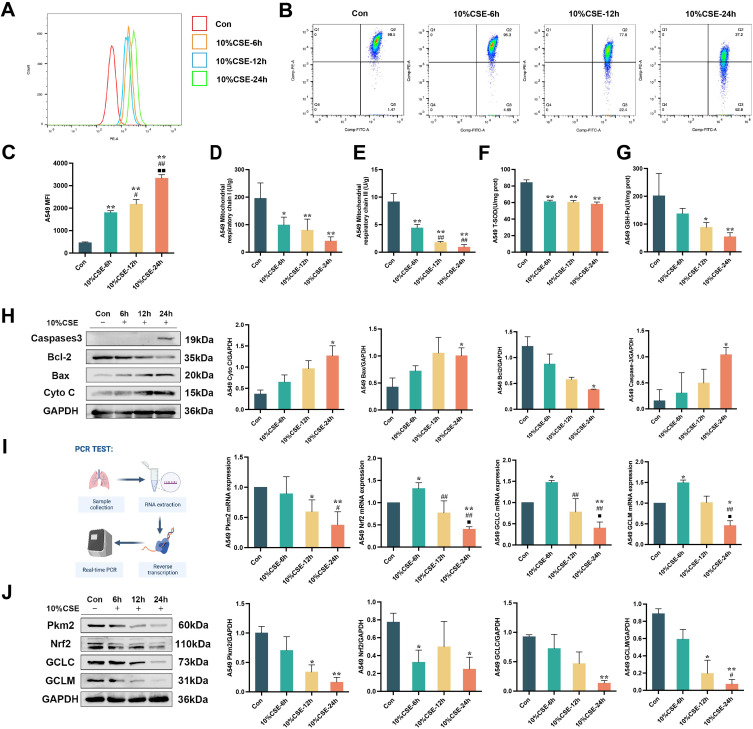
Figure 1.
The effects of CSE on mitochondrial oxidative damage and Pkm2/Nrf2 signaling pathway in A549 cells. (A and C) The effects of 10%CSE induction for 6 hours, 12 hours, and 24 hours on the generation of mROS in A549 cells. (B) Inhibition of mitochondrial membrane potential after 10%CSE induction for 6 hours, 12 hours, and 24 hours. (D and E) Inhibition of mitochondrial respiratory chain complex I and III after 10%CSE induction for 6 hours, 12 hours, and 24 hours. (F and G) Inhibition of T-SOD and GSH-Px after 10%CSE induction for 6 hours, 12 hours, and 24 hours. (H) Western blot analysis for assessing the effects of mitochondrial-related pathway including caspase-3, Bcl-2, Bax, and Cyt-C in A549 cells following 10%CSE induction. (I) Quantitative real-time PCR analysis for assessing the effects of Pkm2/Nrf2 signaling pathway including Pkm2, Nrf2, GCLC, and GCLM in A549 cells following 10%CSE induction. (J) Western blot analysis for assessing the effects of Pkm2/Nrf2 signaling pathway including Pkm2, Nrf2, GCLC, and GCLM in A549 cells following 10%CSE induction. All data are represented as mean ± SD (n=3). *P < 0.05 and **P < 0.01 as compared to Con group, #P < 0.05 and ##P < 0.01 as compared to 10%CSE-6h group, and ■P < 0.05 and ■■P < 0.01 as compared to 10%CSE-12h group.

