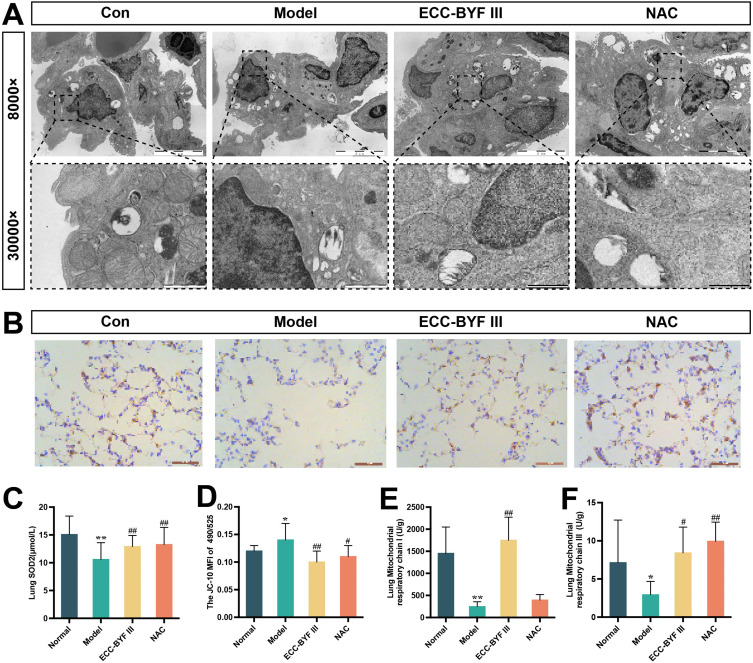
Figure 5.
Effects of ECC-BYF III on mitochondrial function-related indicators in lung tissue of COPD rats. (A) The integrity of mitochondrial ultrastructure in lung tissue. (B) SOD2 immuno-histochemical photomicrographs (200×). (C) SOD2 quantification analysis. (D–F) mitochondrial membrane potential, mitochondrial respiratory chain complexes I and III. All data are represented as mean ± SD (n=6~8). *P < 0.05 and **P < 0.01 as compared to Normal group, #P < 0.05 and ##P < 0.01 as compared to Model group.

