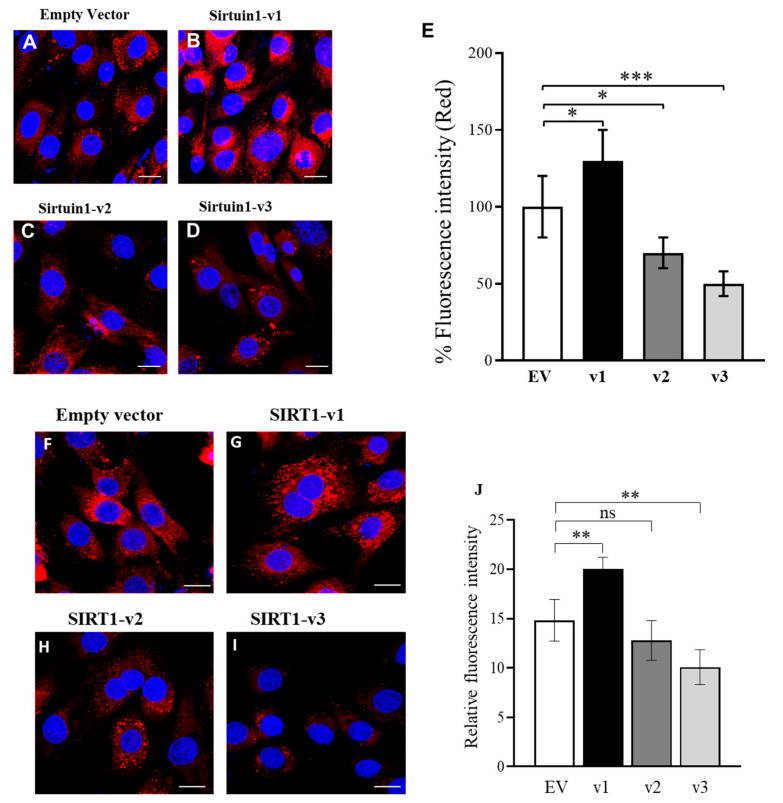
Figure 2.
The mitochondrial membrane potential (MMP) and the mitochondrial mass and content. The SIRT1 isoform constructs were transfected into C2C12 cells. At 24 h after transfection, the cells were stained with the Image-iT™ TMRM reagent (A–E) for the measurement of mitochondrial membrane potential (MMP), or MitoTracker (red) conjugated dye for the detection of the mitochondrial mass and content (F–J). The DAPI (blue) was added for nuclear counterstaining. Empty vector (A); SIRT1-v1 increased the fluorescent signal intensity, indicating the elevation of mitochondrial membrane potential (MMP) ((B,E), * p ≤ 0.01); SIRT-v2 reduced MMP ((C,E), * p ≤ 0.01); SIRT1-v3 reduced MMP ((D,E), ** p ≤ 0.01). The stained cells were randomly selected from microscopic fields in four individual repetitions where the fluorescence intensity was quantified using ImageJ. The fluorescent intensity of clearly identifiable mitochondria in randomly selected 80–90 cells per experiment were measured. Significant difference (n = 4, ns, p > 0.05 * p ≤ 0.05; ** p ≤ 0.01, *** p < 0.001) between EV and SIRT1 isoforms by one-way ANOVA with Tukey’s procedure. Zeiss Plan Apo 63× oil objective is used; scale bars indicate 20 μm.

