Figure 3.
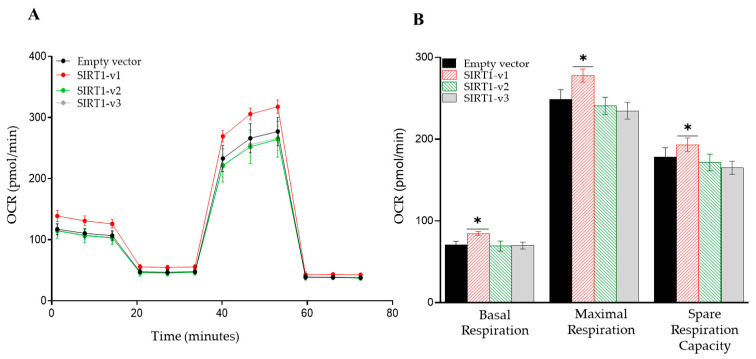
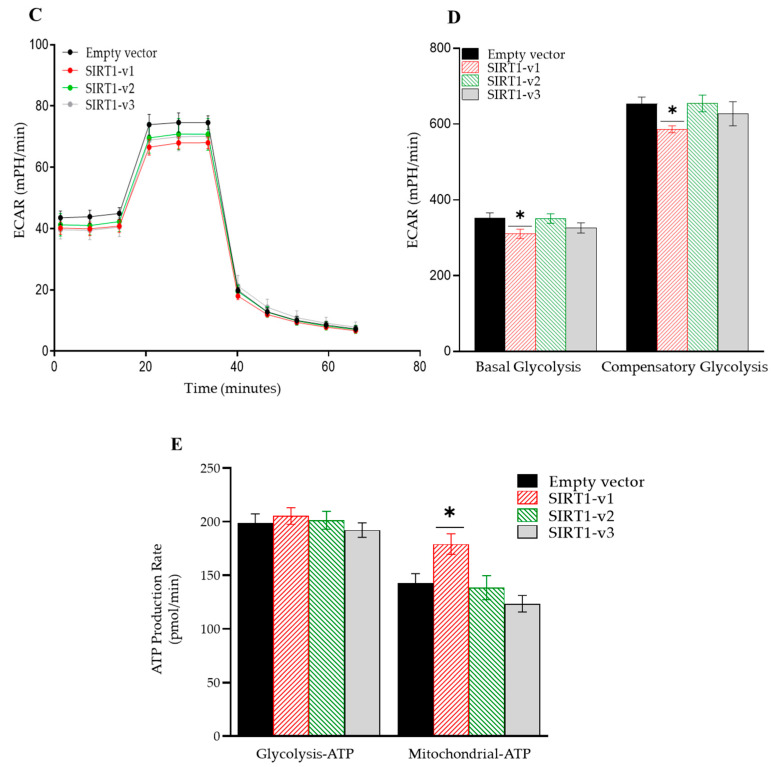
Analysis of the effect of SIRT1 isoforms on mitochondrial function with the Seahorse XFe96 analyzer. Mitochondrial respiratory profile of SIRT1 isoforms. (A) Oxygen consumption rate (OCR) measurements were obtained over time (min) using an extracellular flux analyzer, Seahorse XFe96. (B) Basal mitochondrial OCR of SIRT1 isoform-transfected C2C12 cells was derived by subtracting non-mitochondrial OCR. Maximum OCR was stimulated by FCCP addition. The spare respiratory capacity was calculated as the difference between maximal and basal OCR. (C) Glycolytic rate (ECAR) of SIRT1 isoform-transfected C2C12 cells. (D) A quantitative analysis of the basal and compensatory glycolysis. (E) Quantification of total ATP production rate of C2C12 cells transfected with different SIRT1 isoforms. Graphs represent data normalized with equal cell count, n = 3, one-way ANOVA, Tukey’s post hoc test (* p < 0.05).


