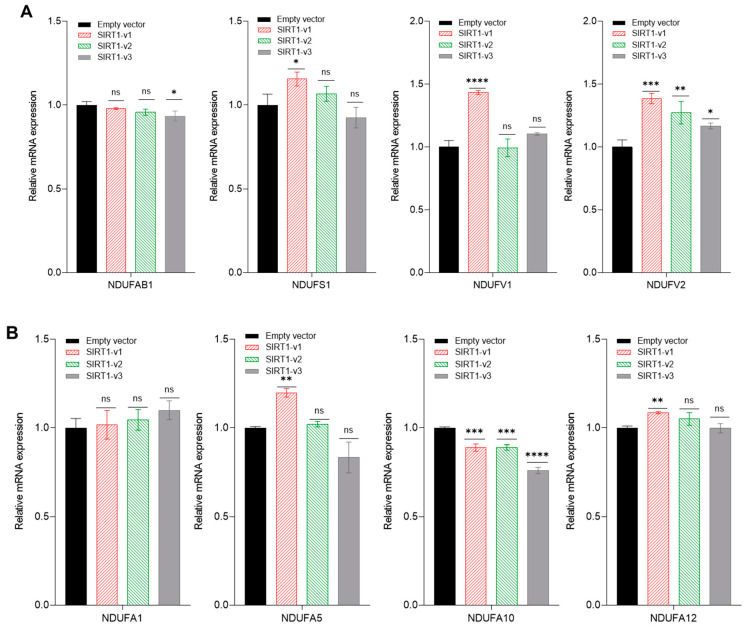
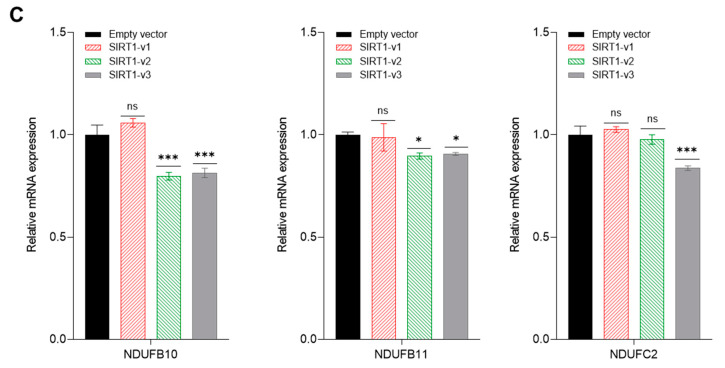
Figure 5.
Real-time RT-PCR analysis of mitochondrial genes at complex I subunits. (A) qRT-PCR analysis of NDUFAB1, NDUFS1, NDUFV1, and NDUFV2 gene expression following the transfection of C2C12 cells with SIRT1 isoforms. (B) NDUFA1, NDUFA5, NDUFA10, and NDUFA12. (C) NDUFB10, NDUFB11, and NDUFC2. Significant difference (* p < 0.05, ** p < 0.01, *** p < 0.001, **** p < 0.0001, ns: p > 0.05, n = 3), analyzed by one-way ANOVA with Tukey’s procedure.


