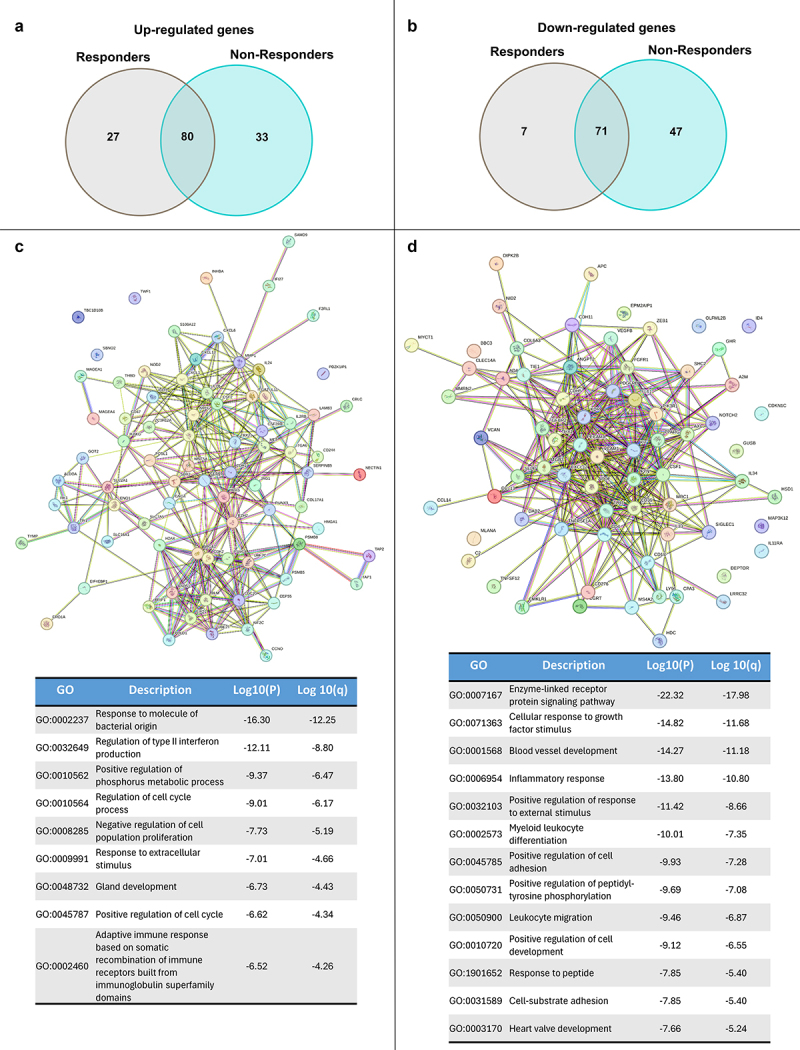
Figure 4.

Venn-diagram of top up-regulated (a) and down-regulated (b) genes (FDR < 0.05) of responders and non-responders samples. STRING DB analysis of up-regulated (c) and down-regulated (d) genes common to responders and non-responders patients with associated (below) METASCAPE analysis and table with gene ontology (GO) annotations.
