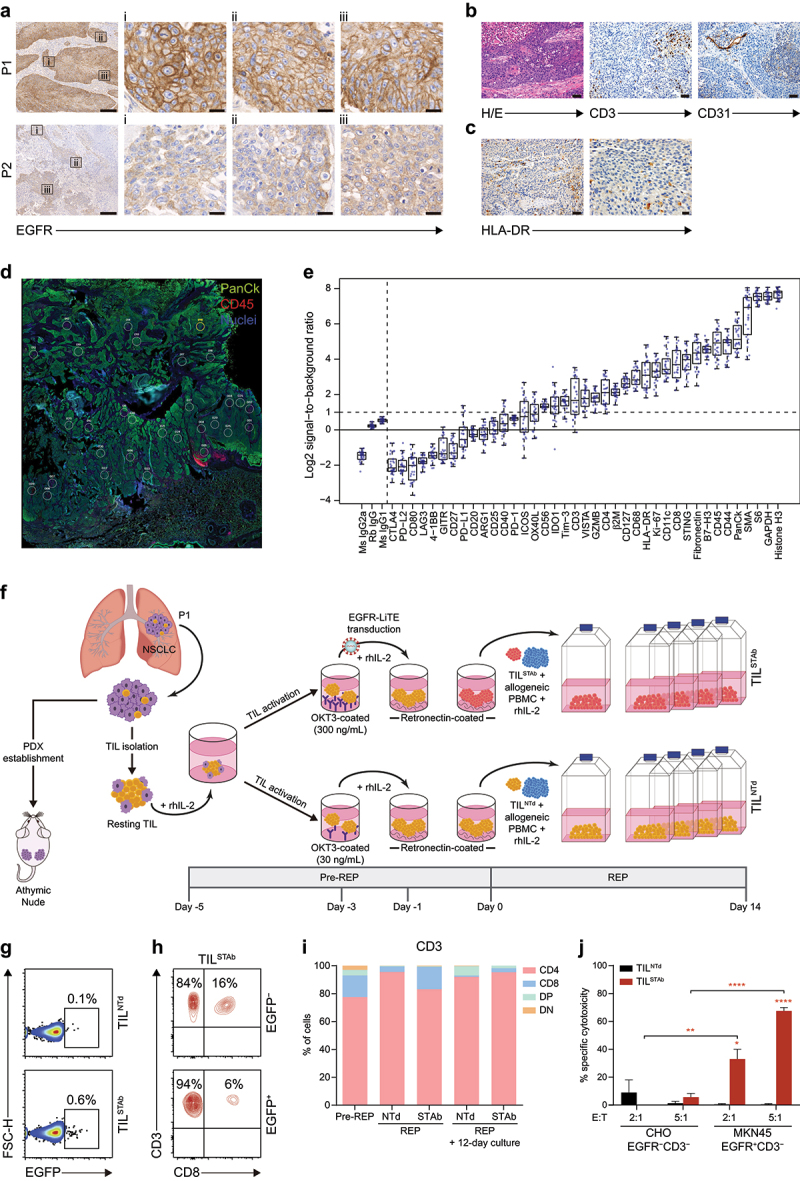
Figure 1.

Phenotype of primary tumors and generation of patient-derived engineered EGFR-TCE-secreting TIL. (a) EGFR expression by IHC in P1 and P2 primary tumors. Magnification of three ROIs (i, ii, iii) from left images are shown. Scale bars: 200 µm and 20 µm in magnified images. (b) Histological detail of the P1 primary tumor (H/E), T cell infiltration (CD3+) and vascularization (CD31+) by IHC. The P1 tumor was a pleomorphic squamous cell carcinoma with atypical dyskeratotic cells and large necrotic areas. Scale bars: 50 µm. (c) HLA-dr expression by IHC in P1 primary tumor. Scale bars: 50 µm (left) and 20 µm (right). (d) DSP image showing the multiple circular ROI of a maximum of 500 µm from PanCk+CD45+ intertumoral areas in P1 primary tumor. (e) Signal-to-noise plot showing the log2-transformed signal (counts of each protein) relative to background levels (averaged counts of the three negative controls) of all markers included in the DSP immune-related protein panel in P1 primary tumor sample. (f) Engineered EGFR-STAb TIL (TILSTAb) small-scale REP generation and PDX establishment from P1 NSCLC primary tumor. (g) Percentage of reporter EGFP expression in non-transduced TIL (TILNTd) and TILSTAb after REP. (h) Percentages of CD4+ and CD8+ T cells within EGFP− and EGFP+ TILSTAb cells. (i) Percentages of CD4+, CD8+, double positive (DP) and double negative (DN) T cells among pre-rep, REP and 12 days after REP cultured TILNTd and TILSTAb cells. (j) Specific cytotoxicity 12 days after REP of TILNTd or TILSTAb cells against egfr-negative (CHO) or egfr-positive (MKN45) cells at the indicated E:T ratios after 72 hours. The percentage of specific cytotoxicity was calculated by adding D-luciferin to detect bioluminescence. Data represent mean + SEM and statistical significance was calculated by two-way ANOVA test corrected by Tukey’s multiple comparisons test; *p < 0.05; **p < 0.01, ****p < 0.0001. TCE, bispecific T cell-engagers; IHC, Immunohistochemistry; P1, patient 1; P2, patient 2; ROI, region of interest; H/E: hematoxylin and eosin; REP, rapid expansion protocol; DSP, digital spatial profiling; SEM, standard error of mean.
