
Figure 3.
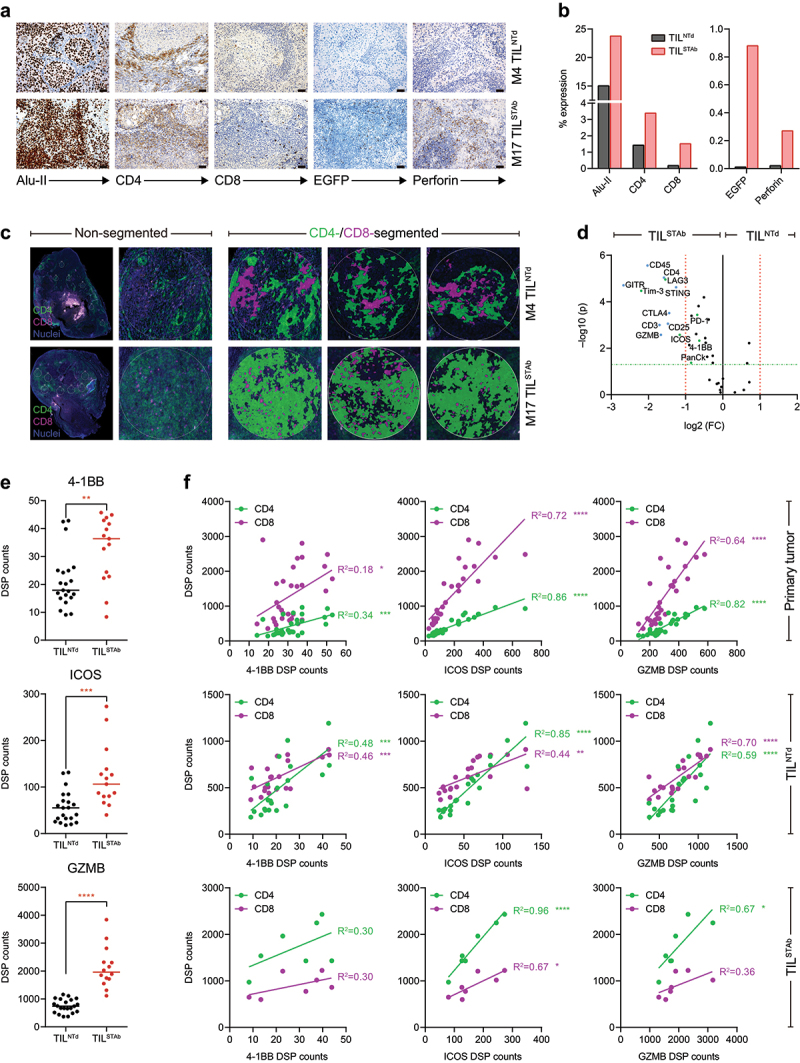
Immunohistochemistry and DSP analysis of intravenously treated NSCLC xenografted hIL2 NOG mouse 4 (TILNTd-treated) and mouse 17 (TILSTAb-treated). (a, b) expression (a) and quantification (b) of Alu-II, CD4, CD8, EGR and perforin after treatment of hIL-2 NOG xenografted mouse 4 (M4) with TILNTd or mouse 17 (M17) with TILSTAb. Scale bars: 50 µm. (c) CD4 and CD8 T cell distribution by DSP from multiple circular ROI of a maximum of 500 µm within TILNTd- or TILSTAb-treated tumors in non-segmented or CD4/CD8-segmented compartments. (d) Differentially expressed protein markers in ROI from tumors treated with TILNTd or TILSTAb within the lymphocyte (PanCk‒CD45+) compartment. Significance (FDR-adjusted p-values) is expressed relative to the FC in protein levels in TILSTAb-treated vs. TILNTd-treated ROI. Markers with an FC > 2 and FDR-adjusted p-values < 0.05 in the two cohorts (TILSTAb- or TILNTd-treated) are marked in bold. (e) Comparative analysis of 4-1BB, ICOS and GZMB levels measured by DSP in non-CD4/CD8-segmented or CD4 and CD8 compartments. Significance in (e) was calculated by unpaired t-test. (f) Linear regression analysis between CD4 or CD8 infiltrated T cells and 4-1BB, ICOS and GZMB in P1 primary tumor, TILNTd-treated M4 and TILSTAb-treated M17 measured by DSP. R2 represents goodness of fit to the model. *p < 0.05; **p < 0.01; ***p < 0.001, ****p < 0.0001. FC, fold change; FDR, false discovery rate; ROI, regions of interest; GZMB, granzyme B.