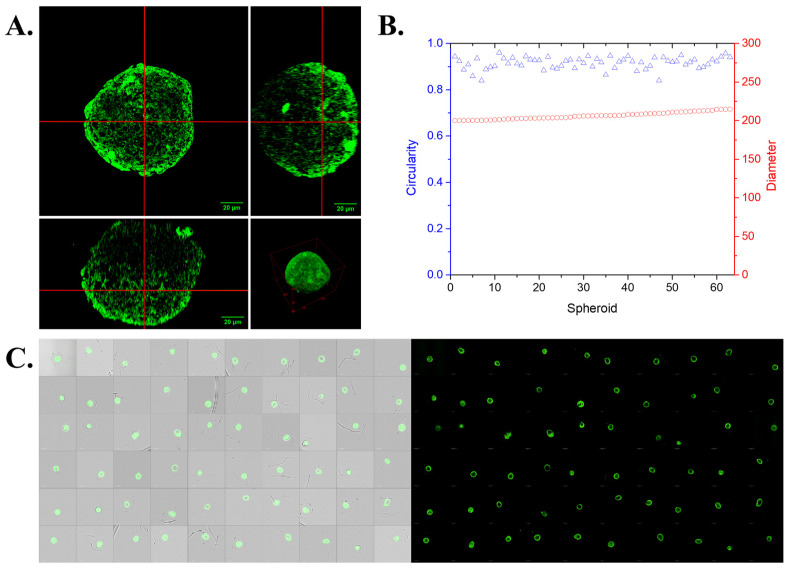
Figure 5.
(A) Z-stack confocal microscopic image of an optically cleared spheroid. (B) The distribution of size and circularity of 66 samples of sorted spheroids. (C) Merged brightfield/fluorescence (left) and fluorescence (right) images of high-content whole-plate confocal tile scanning of a 96-well plate containing sorted GESs. The image was taken from a representative section of the plate, spanning from well B2 to G11, demonstrating the uniform distribution and consistent morphology of the GESs within each well.

